Advanced Theater Transport
Matt Guild - Propulsion
Andrew Gulsrud –Aerodynamics
Justin McClellan - Sizing and layout
Caroline McNally – Structures
Takashi Okamato – Stability and Control
Prepared for:
Professor Wroblewski
Department of Aerospace and Mechanical Engineering
Boston University
April 26th, 2004
Abstract
The Falcor Advanced Theater Transport (ATT) will become the workhorse of the Air Force replacing the Lockheed C-130 and allowing it to meet the airlift requirements of modern warfare. The Falcor incorporates a variable geometry high lift wing with internally blown flaps. The large fuselage allows for bulky military cargo to be loaded and unloaded rapidly. Four high-bypass ratio turbofan engines are used to generate the large amounts of thrust needed to accelerate the aircraft. The Falcor ATT has the performance needed to land and take-off within 750 feet on unimproved runway, while carrying up to 40 tons of cargo. Steep approach angles and high climb rates increase take-off and landing performance for improved survivability in unsecured combat zones.
The aircraft is capable of carrying 2 of the Army’s new 20 ton Stryker Light Armored Vehicle (LAV), a 32 ton M109 self propelled howitzer, or a 30 ton Marine LVTP7. Also, its unique wide fuselage will also be able to accommodate large and odd shaped vehicles such as Patriot Missile Battery or Heavy Expanded Mobility Tactical Truck. Additional fuel stores can be carried for forward area refueling and armament point operations, where smaller aircraft such as AH-64 Apache helicopters can refuel on front lines.
An operational radius of 800 nautical miles at cruise conditions and 30-minute loitering time will make this aircraft ideally suited for operations in hot zones such as Asia and the Middle East. The aircraft’s unique features, along with the capacity to carry extensive cargos deep into a combat zone, will give future US armed forces the element of surprise, agility, versatility, and larger operational range necessary to adapt to a quickly changing modern battlefield.
The Falcor is a versatile
aircraft. It is capable of performing all the missions currently fulfilled by
the C-130 fleet. Because of its capability to land and take-off in very short
distances, the ATT is an ideal aircraft to support homeland security
operations; The aircraft can land and take-off from any smaller, regional
airports, and help transport manpower and equipment in a national state of
emergency.
|
Specifications |
|
|
External Dimensions |
|
|
Length (ft) |
176 |
|
Height (ft) |
42 |
|
Wing Span (ft) |
240 |
|
Tail Plane Span (ft) |
101 |
|
Wing Aspect Ratio |
12 |
|
Wing Area (square ft) |
4,590 |
|
Fuselage width (ft) |
33 |
|
Internal Dimensions |
|
|
Cargo Area Length (ft) |
112 |
|
Cargo Area Width (ft) |
25 |
|
Cargo Area Height (ft) |
18 |
|
Usable Volume (cubic ft) |
50,400 |
|
Weights and Loadings |
|
|
Empty Weight (lbs) |
146,410 |
|
Mission Fuel Weight (lbs) |
51,111 |
|
Max Payload (lbs) |
80,000 |
|
Max Fuel Capacity (lbs) |
131,111 |
|
Max Take-off Weight (lbs) |
280,000 |
|
Max STOL Weight (lbs) |
256,000 |
|
Min STOL Weight (lbs) |
159,410 |
|
Fuel Required for STOL (lbs) |
13,000 |
|
Max Troop Capacity |
300 |
|
Max Wing Loading (lbs/square ft) |
61 |
|
Max Thrust to Weight |
0.43 |
|
Performance |
|
|
Econ. Cruising Speed (kts) |
346 |
|
Stall Speed (kts) |
44 |
|
Max Rate of Climb at sea level (ft/min) |
|
|
Time To Climb (min) |
10.9 |
|
Cruise Altitude (ft) |
35,000 |
|
Ceiling (ft) |
|
|
Loiter Altitude (ft) |
20,000 |
|
STOL Take-off run (4000 ft, 95 deg) (ft) |
400 |
|
STOL Landing run (4000ft, 95 deg) (ft) |
<750 |
|
STOL Take-off Run (OEI) (ft) |
600 |
|
Conventional Take-off Run (20 deg flap) (ft) |
5,950 |
|
Conventional Take-off run (40 deg flap) (ft) |
4,850 |
|
Conventional Landing run (ft) |
2,410 |
|
Tactical Airlift Radius (Nmi / Mi) |
800 / 920 |
|
Max Ferrying Range (Nmi) |
6000 |
|
Max Endurance (35,000 ft, M=.3) (hrs) |
21.73 |
|
Cost |
|
|
Flyaway Cost (2005 $) |
$68,241,762 |
|
Operating Cost per Cycle (2005 $) |
$530,858 |
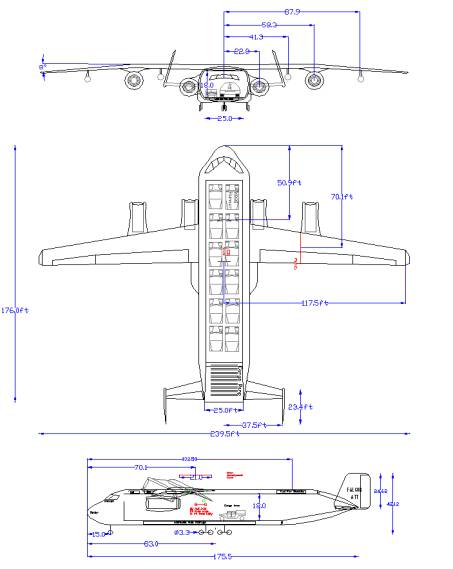
Falcor ATT 3 view
Acknowledgements
Donald Wroblewski
James D. Sullivan
Sheryl Grace
Joe Estano
David Cambell
Richard Almassy – The Boeing Company
John D. McNally – Exxon Mobile Development, Subsea Engineer
www.GlobalSecurity.org
TABLE OF CONTENTS
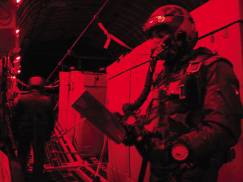
Loadmaster on a C-17 Globemaster III
1. Introduction
The mission profile dominated the layout and shape of the aircraft. The fuselage was sized to very large proportions with oversized cargo in mind. A large wide opening clamshell tail door allows quick loading. The wings are designed to generate large amounts of lift at low speeds.
Active and passive high lift devices are combined to generate coefficients of lift as high as 7.9. Triple-slotted flaps are blown internally (IBF) using by-pass air from the engines. The advantage of using by-pass air is that heavy thermal coatings are not needed.
Pratt and Whitney F117 high bypass ratio turbo fan engines used on the Falcor are the same engines as the C-17 Globemaster III. This commonality leads to added efficiency; ground crews are familiar with the engines and have spares readily available.
Despite the use of composite structures and complicated high lift devices, the Falcor is a relatively inexpensive airplane.
The Falcor gets its name from the dog-like dragon Falkor from The Never Ending Story.
1.1 Purpose
The primary mission of the Falcor ATT is to transport medium weight fighting systems such as the Stryker fighting vehicle and Hummer between forward air bases and front line combat zones. The tactical mission begins at a forward air base with a conventional runway. The Falcor executes a conventional take-off in the distance of 6,000 ft, fully loaded with fuel and 40 tons of cargo. The aircraft climbs to its cruising altitude of 35,000 ft in under 11 minutes and cruises 800 nautical miles to a forward combat area. A super short landing in less than 750 ft is executed at a midpoint 4,000 ft above sea level and at 95 degrees Fahrenheit. Up to 40 tons of cargo is loaded or unloaded through a rear clamshell door. A super short take-off is performed in 400 ft and the aircraft climbs to cruise altitude. A 800 nautical mile return leg is concluded with a landing at a forward air base [ATT].
 Fig.
1.1a Mission profile for
Tactical Airlift
Fig.
1.1a Mission profile for
Tactical Airlift
The Falcor would easily fill secondary missions currently filled by C-130s. The Falcor can perform aerial tanker missions, forward area refueling and armament point operations, and loiter dominated electronic intelligence gathering missions. In a troop-carrying mission, the Falcor can accommodate over 300 armed soldiers.
1.1.1 Military Requirements
The Air Force’s requirements [ATT] for the ATT in addition to its 750 ft SSTOL performance include enhanced reliability and maintainability, oversized cargo capacity, off runway landing gear, and damage tolerance. The ability to carry a wide range of combat systems was a crucial requirement. It should be noted early that the Falcor ATT’s take-off and landing can be preformed in less than 750 ft even with one engine inoperative (OEI).
1.1.2 Comparison Aircraft
Several aircraft were use for design comparisons. None were exact matches but the comparisons are still valuable when scaled appropriately. The Lockheed C-130 serves as a benchmark since the Falcor’s purpose is to replace that aircraft. The YC-14 and YC-15 are used as a comparison STOL transport with blown flap systems. The modern Lockheed C-17 served as a good comparison aircraft even though it is designed for larger payloads and longer range. Other STOL comparison aircraft include the Asuka, QSRA (Quiet Short-haul Research Aircraft) and the Antonov AN-72. Also, an unlikely comparison aircraft, the F-8 Crusader is the only other aircraft with internally blown flaps and a variable incidence wing.
2. Sizing and Layout
Primary design drivers for the Sizing and Layout of the aircraft were cargo volume, weight capacity, versatility, and efficiency. The Falcor is a tactical air-lifter so it must be capable of carrying a wide array of military equipment. The 40-ton cargo limit was chosen specifically to allow for 2 Stryker LAVs [Gordon, & Orletsky]. Sizing the fuselage to fit bulky weapons like the Patriot Missile system and Marine Core LVTP7 was a necessity. The tall fuselage can even accommodate several AH-64 Apache helicopters.
Versatility was another driving force in the design. The aircraft’s high aspect ratio wing allows it to fulfill endurance-dominated missions. The fuel tanks were sized to allow the Falcor ATT to carry all 80,000 lbs of cargo as fuel. Four under wing hard points rated at 10,000 lbs each allow the Falcor to carry a wide variety of external stores.
2.1.1 Methodology
Microsoft Excel was used for most calculations. The initial sizing of the aircraft was done according to Corke and Wroblewski. Wing loading estimations were also made according to class notes from Wroblewski. Initial estimations put the wing loading (W/S) at 55.
The fuel weight was found by calculating weight fractions [Wroblewski] for different phases of the mission and iterating to find the aircraft total weight. Advanced Aircraft Analysis software (AAA) verified the fuel weight and empty weight, predicting them below Raymer and Corke analyis.
Advanced Aircraft Analysis was used to backup many findings. AAA’s prediction of empty weight was used to verify the calculated empty weights. Weight fractions and component weights were also verified using AAA. Aerodynamics information was also verified using AAA.
Weight information was shared with the propulsion designer and aerodynamics designer to ensure proper lift over drag ratio and wing loading. Information about the size and planform of the aerodynamic surfaces was received from the aerodynamics designer and used to calculate weight. Layout and center of gravity (CG) position was changed dramatically with recommendations from the stability engineer. The CG location was repeatedly moved and the fuselage lengthened by 43 ft to accommodate requirements set forth by the stability designer. Information from all designers was collected and input to AAA to obtain stability derivatives. Layout and loading information was shared with the structural designer, as well as weight savings requirements for the materials used in the design.
Figure 2.1.1a Sizing and Layout information sharing flow chart
2.2 Initial Sizing
2.2.1 Weight Sizing
The aircraft gross weight of 280,000 lbs was picked as a maximum design weight. The aircraft weight was primarily driven by the cargo capacity and fuel requirements. The 80,000 lb payload capacity represents a significant improvement over the C-130’s cargo capacity. The payload capacity’s affect on the aircrafts overall size was carefully considered since a compact aircraft was desired. A 10 ton payload increase caused the aircraft size to grow dramatically.
Fig 2.2.1a Payload Capacity vs Take-off Weight
Payload capacities of 20, 30 and 40 tons were examined. The capacity of 40 tons allows for a acceptable wingspan of 235 ft in the range acceptable wing loadings. This is significantly larger than the 133 ft wingspan of the C-130.
Fig 2.2.1b Various payload capacities with Wing loading vs wing span
The 280,000 lb weight represents a small increase of 3% over the the initial sizing estimate of 272,000 lbs.
A crew of four was assumed for the tactical airlift mission. This crew consists of 2 pilots, a loadmaster, and a mission specialist. An additional 2 observers can be deployed to aid the flight crew in the detection of ground threats during approach.
Estimates of the aircraft weight using Corke’s formulas put the aircraft weight at 278,770 lbs. Raymer’s formulas estimate the weight as 276,170 lbs. Their average was used as the aircraft weight.
Table 2.2.1c Weight Estimates using various methods
|
Corke |
Raymer |
AM410 Iteration |
Average |
|
|
32,889 |
41,223 |
|
37,056 |
Wing |
|
2,553 |
2,954 |
|
2,753 |
Horz Tail |
|
2,604 |
1,291 |
|
1,947 |
Vert Tail |
|
22,373 |
28,543 |
|
25,458 |
Fuselage |
|
2,231 |
2,469 |
|
2,350 |
Main Gear |
|
798 |
753 |
|
776 |
Nose Gear |
|
|
|
|
|
|
|
36,920 |
28,400 |
|
36,920 |
Engines |
|
46,040 |
38,171 |
|
42,106 |
Other |
|
|
|
|
|
|
|
146,408 |
143,803 |
148,365 |
146,192 |
Empty Weight |
|
|
|
|
|
|
|
51,368 |
51,368 |
51,368 |
51,368 |
Fuel |
|
80,000 |
80,000 |
80,000 |
80,000 |
Cargo |
|
1,000 |
1,000 |
1,000 |
1,000 |
Crew |
|
278,777 |
276,172 |
278,575 |
277,841 |
Total Weight |
The aircraft empty weight estimates using Corke and Raymer are also backed up by the empty weight of 137,600 lbs found using AAA.
The design mission fuel weight of 51,368 lbs allows for an operating radius of 800 nautical miles. A 6% reserve is factored into that fuel weight. The Falcor is equipped with multiple fuel tanks. The wing tanks have a capacity of 60,000 lbs. The fuel required for the mission will be carried in the wing. As the fuel is burned off, the wing’s proximity to the center of gravity limits extensive CG travel. An under cargo floor fuel tank is capable of carrying 80,000 lbs of fuel, allowing the aircraft to carry its entire payload weight as fuel. A third auxiliary fuel tank of 13,000 lb capacity sits in the aft ceiling just ahead of the rear door. This tank is used to balance the plane when the blown flaps are activated. To execute a fully loaded STOL take-off the aircraft must have about 13,000 lbs of fuel pumped to the aft tank as the Internally Blown Flaps (IBF) are activated. The fuel counters the pitch down tendency of the aircraft as its neutral point shifts about 10 feet back due to the flaps. The 13,000 lb of shifted fuel weight ensures safe stable flight at the slow take-off and landing speeds, when an aircraft is most difficult to control. The aircraft can still safely take-off and land in conventional distances without the shifted fuel.
Over the course of the design process the aircraft weight fluctuated with almost every design change (Fig 2.2.1d). Weight spirals were corrected by reducing the aircraft range and by using composite structures. A reduction in the aircraft’s range was initially done to reduce the weight of the aircraft to allow for the expansion of the wing. It also allowed the easy transition to more powerful, larger engines. When the tail surfaces were added to the design, the use of composites was used to keep the aircraft from breaching the 280,000 lbs maximum design weight.
Fig 2.2.1d Aircraft Gross Weight during design process
Improved fuel consumption also reduced the aircraft weight.
To precisely balance the aircraft, the 277,841 lb weight was divided into 25 individual weight groups (Fig. 2.2.1e). Major components such as the wing were calculated using multiple methods to ensure accurate estimates. Component weights such as avionics are difficult to estimate but the Raymer method for estimation was used.
Fig. 2.2.1e Weight percentages
The cargo and fuel the aircraft carries makes up for 50% of the aircraft weight. This means that in a tanker mission an impressive half the aircraft weight would be fuel. The wing structure makes up for a large 13.9% portion of the weight. The fuselage structure and the engines are the next large contributors to the aircraft weight. Although the air conditioning system only accounts for 1.2%, its versatile placement was thoroughly helpful when balancing the plane.
Initial estimates of wing loading made early on in the sizing of the aircraft were predicted using take-off as a limiting factor. Initial wing loading estimates of 55 psf are quite close to our final values of 61 psf.
2.2.2 Layout
With a wingspan almost as wide as a football field, the Falcor is a large aircraft. The wing size was limited by the wing loading and optimized for the best aerodynamics. The fuselage length was dictated almost completely by the stability engineer. The fuselage cross section is designed to have large amounts of usable space.
Table 2.2.2a Falcor ATT Dimensions
|
External Dimensions |
|
|
Length (ft) |
176 |
|
Height (ft) |
29 |
|
Fuselage width (ft) |
33 |
|
Wing Span (ft) |
235 |
|
Horiz. Tail Span (ft) |
101 |
|
Wing Aspect Ratio |
12 |
|
Wing Area (square ft) |
4,590 |
The cockpit is placed high up in the fuselage, with proper grazing angles taken into account. The large nose area below the cockpit is ideal placement for radar and avionics equipment. The 2 inboard engines are placed low on the fuselage below the vertical position of the center of gravity. The 2 outboard engines are placed on the wing on pylons. Four under wing hard points capable of carrying 10,000 lb loads are located on the wing. The hard points can be used for 1360 gal fuel tanks, jamming equipment, midair-refueling gear, or weapons.
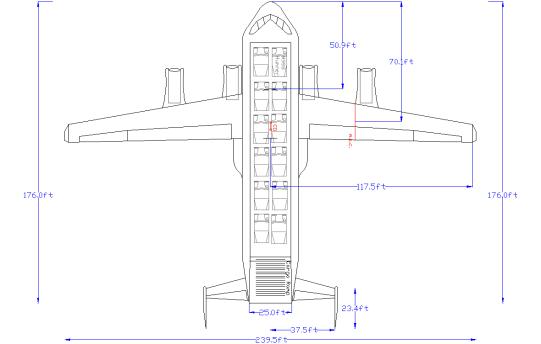
Fig 2.2.2b Falcor top view
The usable cargo area stretches 112 ft long, is 18 ft high, and 25 ft wide. These dimensions were designed so that the Falcor can carry the most oversized military equipment. The length was initially designed to carry 4 rows of M998 HMMWV (Hummer). The fuselage was later lengthened for stability reasons and can now accommodate 6 rows of Hummers. The width was designed to be wide enough to park two M998 Hummers next to each other. A maximum of 12 of the 5,200 lb M998 Hummers can be deployed. Heavier Hummers such as the M1026 and M1044 with additional armor and weaponry can weigh up to 10,000 lbs and would be carried in lesser numbers. The cargo area height of 18 ft was chosen to accommodate tall cargo such as an Apache helicopter or Patriot Missile battery.
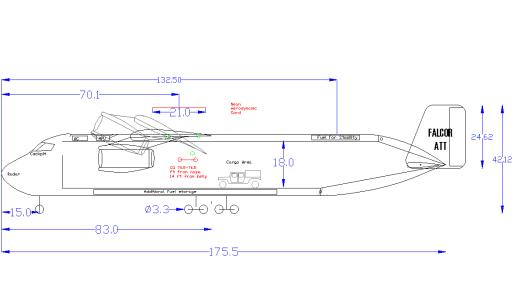
Fig 2.2.2c Falcor Side Layout
The most dynamic feature on the Falcor ATT is the variable-incidence wing and wing box. The Falcor would be the second aircraft built with a variable-incidence rotating wing and internally blown flaps. The first is the F-8 Crusader which incorporated a hydraulically raised wing, pivoting around the rear wing spar. Rotation of the entire aircraft at take-off is not needed; once take-off speed is reached the wing rotates to the take-off angle of attack. Once the aircraft has lifted off and accelerated the wing lowers back down to its trimmed angle of attack.
The rear cargo door is designed like a clamshell with the top and bottom doors converging at the rear of the fuselage. The side section of fuselage stays stationary. The 25 ft wide rear ramp folds down while the top part of the fuselage opens upward, allowing easy, unblocked access to the cargo area. If properly balanced, cargo may be loaded part way up the rear ramp.
The primary fuel storage is in the wing, but additional fuel storage is located under the cargo area floor in the vicinity of the center of gravity. An auxiliary fuel tank is placed near the aft of the fuselage to allow for the pumping of up to 13,000 lbs of fuel to the rear of the aircraft to shift the center of gravity backward when the flaps are deployed. The APU and air conditioner are placed near the front of the aircraft. The balance of the airplane dictated their location.
The Falcor’s cross-section is a rounded rectangle to allow for the maximum usable space in the fuselage (Fig 2.2.2c). The cargo area occupies the center of the fuselage with ample room on either side to allow the crew emergency egress from the rear doors. The space bellow the cargo area floor contains an auxiliary fuel tank. The main landing gear is mounted in gear pods on the side of the fuselage. This allows the gear to retract into the fuselage without restricting the cargo area. The space above the cargo area contains the APU, AC, wing rotation mechanism and wing box, and auxiliary fuel tank.
Figure 2.2.2d Falcor Fuselage Cross-Section
The Falcor’s inboard engines are mounted midway up the fuselage. Their placement almost 4 ft bellow the center of gravity position was dictated by trim analysis. Below the CG, the thrust helps balance the moment created by the blown flaps. They remain stationary, aligned with the fuselage when the wing and wing mounted engines rotate for take-off and landing.
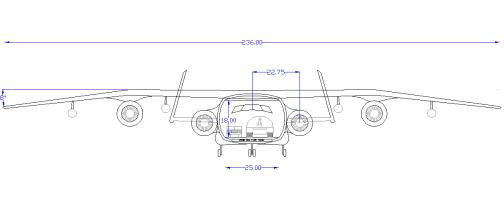
Figure 2.2.2e Falcor ATT front view
The front view of the Falcor shows the bird like wing with 8 degrees of negative dihedral added for increased lateral stability. The Vertical H-tail surfaces slope inward to reduce the radar cross-section of the aircraft. Using bypass air for the blown flaps reduces the Infrared signature of the aircraft. The four under wing hard points are clearly visible, allowing the aircraft to carry a wide variety of external stores. The inline main landing gear allows the tires to roll themselves a compacted strip in the dirt to better support the aircraft on soft surfaces. The load displayed in the hold is a M109A6 Paladin self-propelled Howitzer. At 31.5 tons, M109 can be airlifted in the Falcor, with room for additional ammunition and support equipment. Systems too heavy to be flown in by helicopter like heavy artillery and armored vehicles are now minutes away from remote hot spots. Commanders gain huge flexibility with the ability to airlift artillery to any remote firing position in support of rapidly moving forces.
2.2.3 Landing Gear Sizing
The design requirements for the ATT landing gear require steep approach angles with large sink rates. The landing gear must also be off runway capable. The oleos (shock absorbers) were sized quite large (Fig 2.2.3b), and 4 shock absorbers per strut are used to dampen the impact of landing.
Fig. 2.2.3a Falcor Landing Gear Layout/Footprint
.
Table 2.2.3b Actual Tire Size
|
Actual Tire Size: 40x14 |
|
|
|
|
Rolling Radius |
Max Width (in) |
Max Diam (in) |
Max Load |
|
16.5 |
14 |
39.8 |
33,500 lbs |
The tire sizes were chosen based on the method in Raymer, Ch. 11. The maximum load is well above the loads predicted, and the width and diameter exceed Raymer's recommendations. The large 40-inch diameter allows the tires to roll over brush and debris in the landing area. The wide tires distribute aircraft weight to reduce ground pressure, reducing the chance that the landing gear gets stuck in mud.
Table 2.2.3c Minimum tire size
|
Recommended Main Gear Tire sizing (Raymer) |
|||
|
|
Width (in) |
Diameter (in) |
Load Per Tire (lbs) |
|
|
12.7 |
38.1 |
25,066 |
|
|
|
|
|
|
Recommended Nose Gear Tire sizing (Raymer) |
|||
|
|
Width (in) |
Diameter (in) |
Load Per Tire (lbs) |
|
|
13.4 |
39.5 |
17,694 |
The shock absorbers are sized for the steep approach angle of the Falcor’s STOL landing. The shock absorbers’ stroke of 3 feet and the oleo length of 7.4 ft (Table 2.2.3d) allow the Falcor to cushion landings with very high sink rates as high as –20 ft/s. This rate represents a STOL approach of close to 9 degrees.
Table 2.2.3d Oleo shock absorber size
|
Shock Absorbers |
|
|
|
|
Stroke (ft) |
2.94 |
|
|
Oleo total length (ft) |
7.35 |
|
|
Main Oleo diameter (in) |
3.87 |
|
|
Nose Oleo diameter (in) |
3.25 |
The landing gear retracts into gear pods when not in use. The pods are aerodynamically blended into the fuselage, similar to the ones used on the C-17.
2.3 Center of Gravity Location
The positions of the components throughout the airplane are crucial to the Falcor’s ability to fly. Positions of components such as the auxiliary power unit (APU) and landing gear were fine tuned to adjust the center of gravity position as needed.
Table 2.3a Center Of Gravity Positions and Static Margin with various loads
|
Summary of CG Positions |
|||||
|
|
Lbs Fuel Shifted to Aft Tank |
Take-off CG Feet from Nose |
T/O Static Margin (est.) |
Cruise CG |
Cruise Static Margin (Est.) |
|
Empty CG Location |
0 |
70.86 |
82.3% |
70.86 |
14.4% |
|
Full Fuel, No Cargo/Cargo on CG |
13,000 |
74.84 |
63.3% |
70.59 |
15.7% |
|
No Fuel, Full Cargo (at CG) |
0 |
70.86 |
82.3% |
70.86 |
14.4% |
|
Minimum Fuel for STOL, Full Cargo (at CG) |
13,000 |
76.42 |
55.8% |
70.78 |
14.7% |
|
No Fuel, Full cargo at aft CG (Cargo cg=80ft) |
0 |
74.32 |
65.8% |
74.32 |
-2.2% |
|
Full Fuel, Full cargo at aft CG (Cargo cg=80ft) |
13,000 |
76.36 |
56.0% |
73.36 |
2.4% |
 Figure 2.3b Center
of gravity position in various configurations
Figure 2.3b Center
of gravity position in various configurations
The center of gravity is listed with various load configurations. The aircraft requires 13,000 lbs of fuel to safely execute a STOL maneuver. At short take-off or landing, fuel is shifted to balance the moment created by the 18 ft shift in the aerodynamic center of the wing due to the blown flaps. (See section 3) To maintain the desired static margin, the center of gravity is shifted aft, following the neutral point shift. (See section 5) With the 13,000 lbs of fuel pumped to the aft, the aircraft center of gravity shifts back 4-6 ft. The aircrafts ability to adjust its center of gravity allows it to utilize IBF effectively. When the flaps retract and the fuel is pumped back forward, the CG positions can shift up to 6 ft forward. As a safety margin, the cargo CG has a range of acceptable placement. The Cargo CG can be placed as far forward as the aircraft empty CG point, 70.8 ft from the nose. The most rear the cargo CG may be is 80 ft from the nose. If a load were evenly distributed across the entire cargo area floor, its CG would be at the aft cargo CG limit. Cargo may be loaded part way up the rear ramp, but it must be properly counter-balanced to maintain a safe center of gravity.
2.3.1 Challenges
The Falcor ATT’s shape was largely influenced by the steady state trim and stability of the aircraft at take-off and cruise. The wing’s forward position was dictated by the large shift aft of the neutral point when the blown flaps are activated. The CG was moved forward to get the maximum control arm from the control surfaces.
The wide range of loading configurations shifts the center of gravity up to four feet. Maintaining the balance of the aircraft and the desired static margin was difficult because of the size of this shift. The distance between the aerodynamic center and the center of gravity must remain within an acceptable range when the blown flaps are activated and the aerodynamic center shifts. Placing the cargo area center on the CG was not possible. The aft most cargo CG location had to be the center of the cargo area so a low-density load could utilize the entire cargo floor. The forward CG was limited by the fact that the only way to move the CG forward was to move the whole wing, moving the aerodynamic center also.
Control authority from the horizontal tail proved to be a primary reason for many changes in to the CG and the shape of the aircraft. The more control authority the tail had, the further away the CG could be from the neutral point. Because of the large CG and NP shifts under various operating conditions, the only way to achieve acceptable CG positioning was to extend the fuselage 43 ft. (see section 5)
2.4 Versatility and Survivability
2.4.1 Mission Versatility
The Falcor ATT has been designed to fulfill every mission currently preformed by the C-130. The extremely versatile aircraft is capable of the following missions:
· Transport The Falcor’s primary design mission is transport. Falcor provides that transport to virtually anywhere with a strip of field 750 ft long.
· Aerial Tanker When carrying fuel as cargo the Falcor can transport 131,111 lbs of fuel, almost all of which can be pumped to receiving aircraft through refueling modifications. Navy and Marine Core refueling gear will attach easily to the under wing hard points. Falcor’s excellent loiter fuel efficiency and high aspect ratio allows it to remain on station for extended periods of time.
· F.A.R.P. The Falcor is ideal for Forward Area Refueling and armament Point operations. It can airlift large amounts of fuel and ammunition to rapidly advancing forces. Smaller aircraft like the Ah-64D Apache helicopter could land and refuel at F.A.R.P.s flown in to any location the advancing force needs support.
· SIGNET /
Reconnaissance The Falcor’s endurance of over 20 hours makes it an ideal platform for the gathering of Signals Intelligence, jamming and other offensive information warfare. The under wing hard points allow easy installation of jamming and reconnaissance equipment.
Aerial Gunship The Falcor’s large fuselage, slow loiter speed, and long endurance make it ideally suited for the air support, air interdiction and armed reconnaissance missions. The larger payload of the aircraft allows for more weaponry than the current AC-130 Specter.
2.4.2 Survivability
The numerous survivability considerations in the Falcor ATT design make it an extremely robust aircraft with high mission success rates. All fuel tanks on the Falcor are self-sealing bladder tanks to eliminate fuel leaks due to damage from ground fire. The aircraft has been designed to perform all parts of its mission with One Engine Inoperative (OEI). Even the 750 ft take-off and landing can be executed if an engine is lost.
To reduce the radar cross section of the aircraft, the vertical tail surfaces angle inward at 15 degrees. Using cool compressor bleed air for the blown flap system reduces Falcor’s heat signature.
If the variable incidence wing fails, the aircraft has clearance to rotate at take-off and landing. The aircraft is statically stable in almost all load configurations. In the event of a hydraulic failure the aircraft will continue to fly.
2.5 Summary/Results
The layout and size of the Falcor ATT were driven by its tactical airlift mission requirements. The maximum payload weight of 40 tons was a goal set from early on to make sure the aircraft could accommodate 2 Stryker LAVs. The range of 800 nm is a compromise, but one that still meets the sizing of the fuselage cross-section. The aircraft’s fuel weight was chosen to allow the Falcor the range to operate between realistic base and front line locations. Landing gear was sized to allow the Falcor to approach landing zones at steep angles to minimizes landing distance. Gross weight was sized to accommodate all medium weight combat systems the Falcor might need to transport.
3. Aerodynamics
3.1 Introduction
Aerodynamics plays a crucial role in the development in the Falcor ATT. Even though lift augmentation is required through the use of engines, basic aerodynamics is needed to maximize wing lift and minimize drag. Mission goals were centered around take-off and landing distance. Other mission parameters such as range, cruise speed, and cruise altitude were at the disposal of the designer to optimize.
The first goal, obtaining passive high lift from the wing, was accomplished by using a very large wing in conjunction with an airfoil possessing high CL max and good stall characteristics. Flaps and leading edge slats were implemented to increase total coefficient of lift at take-off and landing. The more lift that could be obtained from the unblown wing, the less dependence on active high-lift devices or reliance on engine thrust there was.
The second major goal was to minimize the total drag. Taking off in short distances relies on producing high amounts of lift that inherently contributes to increased induced drag. Minimizing parasitic drag was the only variable that helped to reduce the total aerodynamic drag. Contrastingly, excessive amounts of drag were favorable during the STOL landing configuration to ensure that the Falcor could stop in the allotted 750 ft ground roll. Since landing is to occur on “soft turf”, breaking power is reduced and must be overcome by air brakes and reverse thrusters.
There were many major design challenges from an aerodynamics point of view. The first main challenge was to determine how to obtain coefficients of lift higher than most other conventional STOL aircraft in order to accomplish the Falcor’s super STOL requirements. The situation is worsened by the requirements to land and take-off at “hot and high” conditions, i.e. 4,000ft ISA and at 95 degree Fahrenheit ambient temperature. This makes the air much less dense, reducing lift. In general the STOL portion of the Falcor’s mission was difficult to analyze since it is a relatively unconventional approach and little data is available. As with most STOL aircraft a common problem arises from designing for take-off and landing requirements. The low value for wing loading required throws off range and cruise conditions. Basically, the excessively large wing creates high drag that is translated to poor cruising conditions and underpowered engines. There was a careful balance in optimizing high lift, low drag and efficiency at all portions of the mission.
3.2 Methodology
The methodology involved taking statistical sizing and weight data and using the stated mission goals to establish preliminary wing loadings. Inputs included take-off and landing distance of 750 ft, cruise of around 800 nautical miles, payload of between 30 and 40 tons and relatively similar performance characteristics to the C-130. Once the wing loading was determined, planform geometric relations, passive high-lift devices, drag buildups, and further layout could be calculated. Once a total drag buildup was accounted for, engines were able to be gradually outfitted and then the passive lift could be considered. From there on, smaller details such as aerodynamic stability derivatives were added in.
The major methods of analysis included design methods of Corke, Raymer, and Roskam that were utilized using an Excel package. Other historical STOL cargo planes were used for comparison (see Tables 3.2a & 3.2b). In addition, a computational fluid dynamics (CFD) computer code SOUSSA was utilized to solidify preliminary results. Advanced Aircraft Analysis (AAA) was used to obtain some of the more complicated aerodynamic derivatives and to verify the analysis. Lastly, a lab test was performed to verify some standard passive lift calculations (see section 3.6).
Table 3.2a Geometric Comparisons to the YC-14
|
|
YC-14 |
Falcor |
|||||
|
|
WING |
H. TAIL |
V.TAIL |
WING |
H. TAIL |
V.TAIL |
|
|
S |
1762 |
603 |
518 |
4590 |
1400 |
934 |
ft2 |
|
b |
129 |
54.91 |
22.97 |
235 |
75 |
25 |
ft |
|
A |
9.44 |
5 |
1.03 |
12 |
4 |
0.85 |
|
|
l |
0.35 |
0.5 |
1 |
0.35 |
0.45 |
0.8 |
|
|
t/c |
.16/.12 |
0.12 |
0.13 |
0.12 |
0.12 |
0.12 |
|
|
Tail volume coef |
- |
1.6 |
0.1365 |
- |
1.47 |
0.08 |
|
|
Fuselage length |
132 |
- |
- |
176 |
- |
- |
ft |
|
Fuselage D |
27 |
- |
- |
29 |
- |
- |
ft |
Table 3.2b Wing Loading Comparison
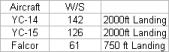
Table 3.2b illustrates the vastly different wing loadings for the Falcor. Reasons for this are primarily super STOL driven and during the end of the analysis it turned out to be too conservative (See recommendations section for further discussion). Historically, STOL aircraft have a wing loading of 60±25, according to Wroblewski. Other aircraft such as the QSRA (Quiet Short-haul Research Aircraft), ASUKA, Boeing YC-14, Lockheed YC-15, and the C-17 have been developed using active high lift devices similar to the Falcor. In addition Boeing and Lockheed are each researching their own ATT aircraft with the same requirements as the Falcor. Data is hard to find, but no mission requirements have ever been as stringent as they have with the Falcor ATT. The Falcor far outperforms any other STOL aircraft before its time.
Figure 3.2a Aerodynamics Design Flow Chart
3.3 Wing Design
The wing design was the first aspect of the Falcor’s aerodynamics. After an optimized wing loading was obtained through carpet plots of thrust to weight (T/W) and wing loading (W/S) (See Section 4), geometric values could be calculated. The important fixed inputs were the wing loading of 61 psf, take-off weight of 280,000 lbs and weight fractions for each mission segment. The variable input parameters were the aspect ratio, cruise Mach and altitude, leading edge sweep angle, airfoil type and taper ratio. The geometry was optimized to obtain maximum lift and efficiency at cruise, the airfoil was optimized to keep drag in the “drag bucket”, trade-studies and historical trends were used to fulfill other values. In addition, a variable incidence wing is implemented to ease STOL take-off where large pitch-down moments are present. (See Section 6 for more discussion)
Table 3.3a Wing Information Summary
|
Design Parameters |
Airfoil data |
||||
|
M |
0.600 |
|
Type |
NACA 641-412 |
|
|
S (wing area) |
4590.164 |
ft2 |
Clmax |
1.670 |
|
|
A (aspect ratio) |
12.000 |
|
Cla |
0.112 |
1/deg |
|
LLE (leading edge sweep) |
10.000 |
deg |
a.c. |
0.267 |
c |
|
l (taper ratio) |
0.350 |
|
a0L |
-2.600 |
deg |
|
Cl beg cruise 1 |
0.475 |
|
Cd0 |
0.005 |
|
|
Cl end cruise 1 |
0.451 |
|
ClminD |
0.400 |
|
|
Cl beg cruise 2 |
0.428 |
|
aCLmax |
14.500 |
deg |
|
Cl end cruise 2 |
0.400 |
|
cm0 |
-0.065 |
|
|
Calculations |
(x/c)max |
0.400 |
c |
||
|
b (wingspan) |
235 |
ft |
(t/c)max |
0.120 |
c |
|
Meff |
0.591 |
|
Sweep Angles |
||
|
Cr |
29 |
ft |
|
x/c |
Lx/c (deg) |
|
Ct |
10 |
ft |
LE |
0.000 |
10.000 |
|
mean aerodynamic chord |
21 |
ft |
1/4C |
0.250 |
7.756 |
|
y_bar |
49.2 |
ft |
a.c. |
0.267 |
7.603 |
|
Oswald efficiency e |
0.698 |
|
|
|
|
|
CLa |
0.091 |
1/deg |
(t/c)max |
0.120 |
8.926 |
|
CLo |
0.238 |
|
TE |
1.000 |
0.907 |
|
atrim |
2.596 |
deg |
Viscous Drag |
||
|
CLtrim |
0.570 |
|
Veff |
574.931 |
ft/s |
|
k |
0.033 |
|
qeff |
122.004 |
lbf/ft2 |
|
CD beg cruise1 |
0.019 |
|
REmac |
2.986E+07 |
|
|
CD end cruise1 |
0.017 |
|
Swet |
9361.180 |
ft2 |
|
L/D (end cruise 2) |
24.817 |
|
F (form factor) |
1.459 |
|
|
Total Drag Beg |
11058. |
lbf |
Q (interference) |
1.600 |
|
|
Total Drag End |
9794 |
lbf |
CD0 |
0.0117 |
|
|
|
|
|
|
|
|
|
|
|
|
|
|
|
3.3.1 Aspect Ratio Trade-study
An aspect ratio of 12 was determined via a trade-study that concluded that there was a minimum drag at cruises due to the choice. Every time the weight is changed, the wing must grow larger and drag is increased. There is interplay between adding weight and risking losing power from our engines to overcome increasing drag, thus every effort was made to reduce cruise drag. As evident in Figure 3.3.1a, there is a minimum in drag for an aspect ratio of about 20, however this minimum is not drastically lower than the Falcor’s value of 12. Twelve was chosen in order to keep the wingspan compact and near the same length as the C-130. Figure 3.3.1b demonstrates the reason why there is a maximum. The coefficient of drag is comprised of the parasite drag and induced drag. Parasite drag is a function of coefficient of friction Cf that goes as 1/(Reynolds’s number)MAC. If the aspect ratio increases, the span increases while the mean aerodynamic chord (MAC) decreases and the friction coefficient slowly goes up. However, the larger effect lies in the induced drag. Induced drag is defined:
CD,induced= (1/pAe)CL2
Graphically, a combined minimum is found around A = 20.
Figure 3.3.1a Aspect Ratio Trade-study
Figure 3.3.1b Contributions of Drag from Aspect Ratio
The Falcor’s relatively large aspect ratio makes it ideal for loiter dominated missions.
3.3.2 Geometric Considerations
With the aspect ratio locked in, other geometric relations could be automatically calculated. A cruise speed of Mach 0.6 was used for several reasons. First of all, the critical Mach number for Falcor is 0.72. Since time to theatre was not a crucial mission parameter, cruise speed could be kept lower than other transport aircraft avoiding any effects of transonic drag rise. In addition, at this lower speed the wing sweep could be kept to a minimum. Minimum wing sweep contributes to maximum high lift device effectiveness. Lastly, there are reasons based on propulsion studies (See section 4). The sweep angle and taper ratio were fit based on historical trend lines [Wroblewski]. Cruise altitude was chosen purely for propulsive reasons (See section 4).
3.3.3 Airfoil Selection
Airfoil selection for the Falcor was particularly sensitive due to the extremely large reference area of the wing. For comparison the Boeing 747 aircraft has a wing area of roughly 5,500 ft2 and a take-off weight of almost one million pounds. The Falcor ATT’s wing reference area is 4,590 ft2, more than the floor space of a typical 6-bedroom house in the U.S., with a 280,000 lbs take-off weight [http://www.boeing.com/ commercial/757family/pf/pf_facts.html]. This large area translates to some very large dimensions in the thickness of the airfoil. Space and considerations for fuel was of little concern due to this large volume. Therefore an airfoil with a thickness to chord ratio (t/c) of 0.12 was used to save large amounts of drag. Even with this t/c ratio, the root of the wing is still around 3.5 feet thick. Making the wing thinner would have given bad maximum CL characteristics and would not have performed well at the Falcor’s subsonic cruise and loiter speeds not to mention being heavier structurally. The problem with having too thin an airfoil is that the extent of the drag bucket is not as large. By doing a trade-study it was discovered that airfoils outside the drag bucket produced astonishingly high values of drag. For example, drag was as high as 80,000 lbs with the NACA 652-015. Therefore, an airfoil was chosen to fit the design cruise CL, lie within the extent of the drag bucket for both portions of cruise while having minimal thickness for a subsonic airfoil. The result of this analysis was that the NACA 641-412 would best suit the Falcor with a total drag of around 10,000 lbs.
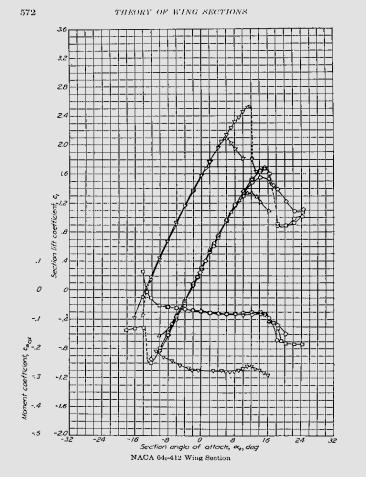
Figure 3.3.3a NACA 641-412 lift curve [Abbott and Von Doenhoff, 1959]
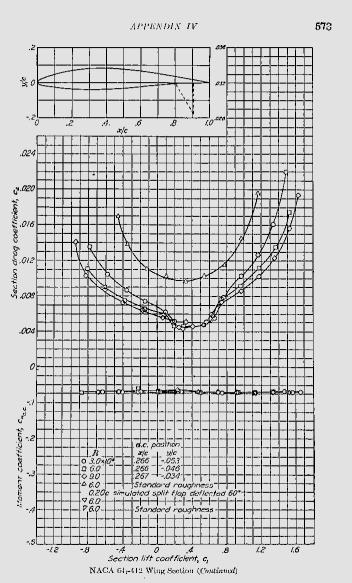
Figure 3.3.3b NACA 641-412 Drag curve [Abbott and Von Doenhoff, 1959]
3.3.4 Results
With the size of the wing relative to the size of the aircraft, it is no surprise that the wing comprises a major portion of the drag. Choice of a thinner airfoil that would sit in the drag bucket was crucial in minimizing drag. The cruise Mach speed was also important in ensuring a low sweep for high lift device effectiveness, in reducing skin friction drag along the wing, and ensuring that the critical Mach number is never obtained in a normal mission. Planform relations were based on other similar aircraft. The results arrived match those of other similar aircraft and are consistent.
3.4 Drag Summarization
Drag has been an important parameter because it has justified the size of the engines used on the Falcor. Drag has a lot of variance due to the various configurations of the Falcor. The design of the tail was a work in progress. Eventually, the tail needed to be sized based on take-off rotation requirements, and from there it was included in the drag analysis. Naturally, once the fuselage was sized for cargo, its contribution to drag was analyzed. The size of the fuselage also consistently grew as control constraints required it. In addition, drag was calculated for the widened gear pods used for Falcor’s main gear. Interference effects were taken into account for both the wing mounted engines and the hard points installed. Finally nacelle drag and miscellaneous drag was accounted for using percentages of total parasitic drag [Wroblewski]. Coefficient of lift can be divided by coefficient of drag to obtain a lift to drag ratio (L/D), a vital parameter for the propulsion engineer. At steady cruise lift equals weight and drag equals thrust, thus the thrust to weight ratio (T/W) can be applied for propulsive analysis.
3.4.1 Tail Design
The initial concept for the vertical tail was that there would be none, similar to Boeing’s ATT design. The initial design called for a lifting canard, which would help a positive pitch moment at take-off and could assist in lift. Eventually winglets were added for some yaw stiffness and very low values of CD0 were obtained. Upon further analysis the conclusion was made that a large horizontal tail and an average sized “H-tail” were needed (See Section 5). This tail was placed for optimal wake consideration and maximum effectiveness. Due to the low take-off speeds at STOL conditions, dynamic pressure across these control surfaces is very small. Historically, such as with the YC-14, tails have been excessively large on STOL aircraft (See Figure 3.4.1a).
Figure 3.4.1a The YC-14’s large Vertical Tail
The large vertical tail problem was avoided by having four engines instead of two thus making a one-engine out yaw problem less serious. The result was that CD0 increased significantly, but not more than Falcor could handle.
Figure 3.4.1a CD0 progression due to varying tail design
Parasitic drag is small compared to the induced drag and was only significant at cruise. Due to the large pitch-down moments at take-off, a large negative CL of the tail is required at STOL take-off. This was the design driver in the sizing of the horizontal tail and resulted in the volume coefficient being greater than 1. In addition, the H-tail allows for unobstructed cargo loading. Fully-spanned very large elevators that acted like a split flap are needed to obtain the CL max of plus or minus 2.3. The airfoils used for both the vertical tail and horizontal tail were the symmetric NACA 641-012.
3.4.2 Fuselage Drag
Drag from the fuselage was not a large variable. Although the fuselage length increased significantly, total drag increased less than 4.5%. Basically, the drag from the fuselage is comprised of friction as the air moves along the surface. Vortex generators have been implemented throughout the fuselage to re-energize the boundary layer and keep separation small, thereby minimizing drag using a “straking” effect. The frontal area was chosen to maximize cargo capacity while not compromising too much to cross-sectional drag. Lastly, the design of the front and rear of the fuselage was selected to minimize drag. Since angles of greater than 24 degrees result in flow separation and greatly contribute to the drag, the fuselage bottom angle was designed large enough to account for rotation at conventional take-off where the movable wing is not used. A simple slow taper was used to ensure a sleek aerodynamic shape.
3.4.3 Clean Drag
A drag buildup was completed when the tail design and fuselage design were locked in. The weight was also locked in, so that even if the aircraft needed to “gain weight” either landing performance or range would be sacrificed rather than iterating the whole process. The parasitic drag contribution is summarized in Figure 3.4.3a.
Figure 3.4.3a Parasitic Drag Breakdown
The wing as expected comprises the leading source of drag, with the fuselage and horizontal tail also providing a bulk of the drag. The final value for parasitic drag turned out to be 0.0319, slightly higher than other cargo aircraft, but acceptable when one considers the STOL requirements limiting optimization.
3.5 High Lift Devices
The Falcor is a heavy aircraft. Even with the large wing and relatively low wing loading, the Falcor still takes about 6,000 ft to take-off conventionally without the aid of any high-lift devices. Typically, flaps and slats can increase CL to about 2.5 resulting in shortened landing and take-off distances. The Falcor utilizes triple-slotted flaps and leading edge slats resulting in an impressive conventional take-off distance of 4,000ft [Corke,2003]. STOL aircraft require coefficients of lift more in the range of 5 to accomplish short take-off distances [Corke, 2003]. This can only be accomplished with the use of active high-lift devices. The extremely high coefficient of lift required for STOL take-off of less than 750 ft. is accomplished through highly efficient internally blown flaps.
3.5.1 Flapped Lift and Drag Calculations
Lift and drag contributions with the addition of flaps and slats were calculated following the procedures of Corke. The ratio of the wetted area of the flap to the wing area (SWF/S) was chosen at a value of 0.7 to maximize the blown area of the flap without sacrificing room for the ailerons. The flaps were sized to be 20% of the chord and to be fully extending triple-slotted flaps. Triple-slotted flaps are the most effective passive high lift devices for the Falcor. Triple-slotted flaps increase CLa increasing maximum lift, only at the expense of a decreased stall angle. The Falcor’s flap system allows for flap deflections of zero to sixty degrees in ten degree increments.
Table 3.5.1a Flap lift and drag summary
The 60 degree flap deflection would only be used after touchdown to increase drag along with spoilers. A 40 degree flap deflection yields the maximum lift and is used during the STOL portion of the mission as well as the conventional landing. A 10 degree flap deflection is used during the conventional take-off. When a 40 degree flap deflection is used the penalty of a decreased stall angle is small, reduced by 2.75 degrees. To further overcome this problem, boundary layer control is used in conjunction with the blown flaps (see next section). The value of the flapped CLa was obtained by taking base CLa and multiplying the effective chord with flaps deployed by base chord (C’/C). This number was also verified in the lab experiment.
 Figure 3.5.1a Conventional Drag Polar
3.5.2 Internally Blown Flap
Due to the fact that Falcor takes off in very short distances, active high lift devices are utilized to maximize the coefficient of lift. This is attained by using a method called internally blown flaps (IBF), which ducts compressed air from the engine through the wing, and blows it at a high velocity across the triple-slotted flaps. The air is also blown across the leading edge of the wing, providing boundary layer control. The Falcor requires extremely high angles of attack (about 30 deg) at take-off and since the flap deflection is also high, the stall angle is quite low. Boundary layer control works by energizing the boundary layer along the wing and forces the flow to stay attached thereby increasing lift and stall angle. The Coanda effect is responsible for the flow turning at high angles as flow follows the deployed flaps. The majority of lift ends up being created from the thrust used in blowing. The YC-14 used upper surface blowing which is easier and lighter in implementation. The Falcor’s internally blown flaps require ducting and bleed losses from the engine, but were opted for because of its higher efficiency and higher CLmax. A description of the various contributions to lift follows in Figure 3.5.2a.

Figure 3.5.2a Contributions to Lift
The main lift contribution from the wing and flaps was calculated using Corke’s approach for triple-slotted flaps. Since the maximum coefficient of lift is known for the airfoil in use, the lift added from the flaps and slats is linearly added. Using drag polar data from Boeing’s YC-14 high lift device tests [Goodmanson, L. T. and Gratzer,G, 1973] an initial estimate was used to find lift from the internally blown flap. There are three basic effects that contribute to this lift. The smallest effect is the boundary layer control denoted Cm which is thrust blown over the leading edge. The coefficient of thrust, Cj, which is blown over the flaps is defined as:
![]() [Wroblewski]
[Wroblewski]
Falcor’s IBF is based on a Cj of 2 since this is the extent of data available. This increases the velocity dramatically and creates lots of extra lift at the rear flaps. The exit velocity times area has to be equal to that of the free stream velocity, V0 , times the flapped area. This is because:
![]()
and since ![]()
and ![]()
it follows that ![]()
assuming the density is a constant we are left with
![]()
Thus the total velocity over the flap is more than doubled assuming the exit area of the IBF (A) is less than or equal to the blown wing area (Sw). The most important effect is the vectoring of the thrust. Since the thrust is being blown over the rear of the wing, it is turning 40 degrees as it follows the flap, and is effectively adding to the lift in a vectored fashion. In fact, the Boeing data is base lined by this vectored thrusting (See Figure 3.5.2a). Also see Section 4 for a discussion of Falcor’s calculations. The thrust that is projected into the lift direction reduces the effective lift needed to take-off. This in turn lowers the induced drag term in total drag. Additionally, ground effect at take-off helps in lowering induced drag. There is also a component of the blown thrust that can be projected into the direction of travel and if it is large enough can actually result in an “effective” negative coefficient of drag. The Falcor lies in this regime during STOL take-off.
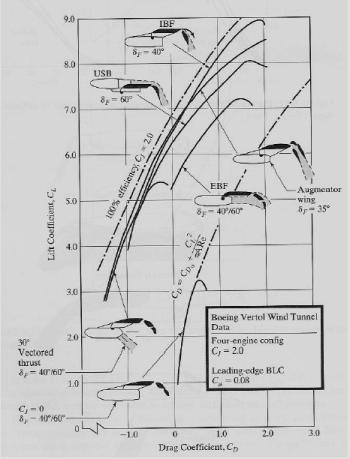
Figure 3.5.2a Boeing High Lift Study [Goodmanson, L. T. and Gratzer,G, 1973]
As evident in the above Figure 3.5.2a, IBF produces the greatest CLmax. Basically Falcor has multiple drag polar plots based on the configuration. Another advantage to IBF as compared to upper surface blowing (USB) is that it can be turned off at will. USB will always produce extra lift which keeps induced drag high at all times. In fact, the YC-14’s drag is higher than the Falcor’s at cruise even though the YC-14 is a smaller aircraft. Falcor’s drag coefficient is never higher than 0.0394 at cruise whereas the drag for the YC-14 can be as high as 0.0440 [Goodmanson, L. T. and Gratzer,G, 1973]. Because of this ability to turn off and on, Falcor’s drag polar has two curves; one is a base line with no blowing active and the other for STOL take-off and landing when blowing is activated. There is a large difference as evident in the Figure 3.5.2b below.
Figure 3.5.2b Falcor Drag polar for both blown and un-blown condition
3.5.3 Neutral Point/Aerodynamic Center
Once all lift and drag analysis was calculated for each configuration, aerodynamic analysis was basically completed. However for stability and control consideration, the aerodynamic center (AC) is an important parameter to calculate. The aerodynamic center at cruise was found using Roskam’s data for the NACA 641-412 and was verified using SOUSSA. With the flaps down, the aerodynamic center was calculated according to the principles on page 291 of Roskam. The aerodynamic center shifted back to about 10 ft as a result of the flaps being deployed. However, the AC does move as a function of Cl. Cl is a function of the three-dimensional CL, calculated using Corke’s method. As angle of attack increases and lift increases, the net lift produced moves forward [Roskam, 1998].
Figure 3.5.3a AC Travel vs. CL
In addition the pitching moment of the wing is important. Even without the effects of IBF, the pitch-down moment at take-off as a result of the flaps deployed is considerable. The addition of IBF adds many new difficulties in rotating at take-off (See Section 5).
Figure 3.5.3b Pitching Moment versus Cl
This led to a unique challenge because this analysis did not include aerodynamic center travel due to IBF effects. Since IBFs are an unconventional approach not commonly utilized, there is little data related to the field of aerodynamic center. Therefore a simple analytical problem was set up. In reference to Figure 3.5.2a it is evident that the location of each individual lift contribution is known. Some assumptions were made: The lift due to the leading edge was taken as the boundary layer control plus the lift contribution due to the slats and chosen to act at the front of the wing. The lift due to the flaps is known and the location is known by Raymer’s analysis. The vectored thrust is taken to act at the first slot between the trailing edge of the wing and the leading edge of the flap. Lastly, the unknown lift due to blowing is found by taking total lift required and subtracting the other known values. The location of this blown lift is taken to act at the quarter chord of the flap. The position at this point can be found using a simple balance of the moments on the wing. This analysis gave the final position of the aerodynamic center during a STOL take-off, which was vital to center of gravity placement and tail sizing. Since so much lift is being produced at the rear of the wing, the final aerodynamic center is pushed back a total of 18 ft during STOL take-off and landing. This large aerodynamic center variation led to many challenges in take-off rotation and cruise. Because of this large shift, there are problems with center of gravity and neutral point shifts. As a partial solution, a rotating wing is used at take-off to produce the correct lift to avoid the difficulty of rotating the entire aircraft to a high angle. In addition, the tail moment arm needed to be extended by lengthening the fuselage and the surface area had to be increased in order to have adequate control.
3.6 Lab Data
The lab was originally going to be run to test the Falcor’s IBF estimates, however the needed material for replicating compressed engine air was not available. Instead, the lab was used to test the Falcor’s airfoil at various flap deflections in order to verify unblown maximum coefficient of lift, pitching moments, and CLa. This gave a better understanding of the aerodynamics at conventional take-off. It also gave an appreciation of how much the stall angle is increased when IBF is utilized. Stall angles turned out to be as small as 8 degrees without IBF active. The angle to rotate at STOL take-off is on the order of 30 degrees and is accomplished only by boundary layer control. A drawing of the lab model used is included. The triple-slotted flap was simplified to a split flap airfoil with extra chord length.
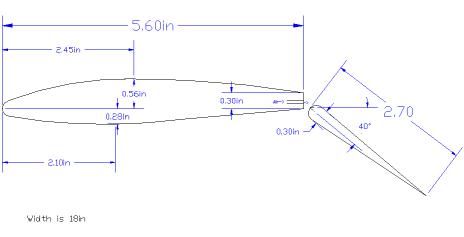 Figure 3.6a CAD Drawing of Lab Test Model (Drawn by
J. M.)
Figure 3.6a CAD Drawing of Lab Test Model (Drawn by
J. M.)
3.7 Advanced Methods
In order to calculate more advanced aerodynamic properties, aerodynamic computer programs were utilized. SOUSSA and AAA were both used to not only verify certain aspects of aerodynamics but to obtain values not easily calculable.
3.7.1 SOUSSA
SOUSSA is an inviscid aerodynamics code ran through MATLAB. Inviscid means that is cannot recreate any kind of skin friction or parasite drag. However, it can calculate lift and induced drag. Inputs include wing geometry, angle of attack, and flight Mach number. By changing the angle of attack, a good estimate of CLa can be obtained. SOUSSA was run at cruise conditions, so no flap or IBF effects were included. SOUSSA outputs gave lift distribution in both the chordwise and spanwise direction. This information was passed on to the structural engineer for design of the wing structure. It also verified lift at cruise, which turned out to be higher than predicted, but still inside the drag bucket. The drag calculation was very close to the initial drag estimates. Outputs of both lift and drag are normalized to the surface area and must be multiplied by the factor
![]()
in order to get actual values of CL and CD. Lastly, the Oswald efficiency factor (e) was backed out by setting our calculated induced drag (kCL2) to SOUSSA’s output induced drag. The value k is also defined as:
k = 1/(pAe)
Setting these two values, gives a SOUSSA calculated e of 0.631 compared to our value of 0. 698. A drawing of wing geometry and lift distributions is included in Figure 3.7.1a on the next page.
 Figure 3.7.1a Wing Geometry output from SOUSSA
 Figure 3.7.1b Chordwise Lift Distribution output from
SOUSSA
Figure 3.7.1b Chordwise Lift Distribution output from
SOUSSA
3.7.2 AAA
Although AAA involves many inputs, it outputs a wealth of information. Most input values were basic aerodynamic parameters that were already calculated. Many of the values were too exact for the scope of this analysis and were estimated. For example the gap of the triple-slotted flap is required as an input. Once all values were entered, AAA output important aerodynamic stability derivatives and verified other parameters calculated based on other approaches [See FalcorAAA.aaa].
3.8 Results and Summary
Falcor was a unique challenge because it has multiple configurations. At each case different altitudes, speeds, densities, and lift are different. Since the Falcor was optimized for minimal take-off and landing with a large payload, cruise became a crucial factor. Weight had to be kept very close to constant, as slight changes could throw the Falcor out of the drag bucket during cruise. A change in propulsion with T/W or a change in sizing or range would throw off all of the aerodynamics. Thus the design process was spent constantly updating and re-evaluating every change and its ramifications. Unconventional approaches were used to analyze situations where there is little published data. Aerodynamic analysis lead directly to the requirements for the propulsion engineer, and the two worked closely together throughout the design. Many methods were used to evaluate and re-evaluate aerodynamic parameters and results. The end result is that the Falcor is completely understood at each configuration. For each configuration, the drag polar is known, lift distributions have been calculated, the lift-curve slopes are known, and aerodynamic performance is understood. Some interesting performance results are included.
Figure 3.8a Stall speeds for Falcor in various configuration
Figure 3.8b Coefficients of Lift in various configurations
Figure 3.8c Take-off and Landing Distances for The Falcor
4. Propulsion
4.1 Introduction
The propulsion system of the Falcor is powered by four high bypass ratio (HBR) engines to meet the power and thrust needs at each point of the mission. The critical STOL portion of the mission requires not only high thrust to accelerate the aircraft quickly, but also must provide air to the active high lift devices in a hostile environment. To properly design and analyze the Falcor propulsion system required considerations of the engine cycle performance due to changes in atmospheric conditions, flight speed, and a thorough understanding of the flow related issues involved with internally ducting engine bleed air.
4.2 Methodology
The Falcor propulsion system is governed by the design constraints that result from the mission requirements. The key propulsive performance values are the thrust and fuel consumption, both of which are functions of the specific engine. By taking advantage of the non-dimensional thrust-to-weight ratio, the Falcor thrust requirements were considered independent of aircraft weight and the specific engine (for operation near sea level at slow speeds). The thrust-to-weight is strongly affected by the wing loading, both of which are discussed in-depth in the next section. This analysis allowed for the determination of an effective engine based on the thrust needs of the mission. Using Mattingly’s Perf software, the performance of the engine was analyzed at a variety of off-design altitudes and speeds. The engine operation could then be corrected with installation effects and other losses incurred at different aspects of the mission. Specifically, in-depth STOL operation analysis was conducted based on theoretical flow loss and induced drag effects from the blowing, as well as empirical lab data on different active high lift methods.
.
4.3 Propulsion Design Parameters
Two important parameters that affect the overall mission operation of the Falcor are the thrust-to-weight and wing loading. The design selection of these parameters is based on the mission requirements for different segments, especially STOL and cruise. These parameters, once selected, have a large affect on the shape and performance of the aircraft.
4.3.1 Thrust-to-Weight
The thrust-to-weight (T/W) ratio is a vital non-dimensional aircraft parameter that represents a measure of the relative strength of the propulsion system for a given aircraft. It varies with speed, altitude, and time (as the weight of the aircraft decreases while fuel is burned). This wide variation is overcome by stating the thrust-to-weight at a given point in the mission; usually at sea level static conditions. The thrust-to-weight for various conditions are listed in Table 4.3.1a.
Table 4.3.1a Installed T/W at various flight conditions
![]()
The variations of thrust at different operating conditions is a result specific to a given engine type. The Falcor utilizes a high bypass ratio engine, the characteristics of which are discusses at length in section For the design of the Falcor propulsion system, all the thrust-to-weight requirements were calculated and referenced to the initial take-off. By analyzing the military’s requirements for the ATT, a range of acceptable thrust-to-weight values can be determined. It turns out that thrust-to-weight varies greatly with the wing loading (W/S) of the aircraft. This is not necessarily an intuitive relationship; however, if one notices that the coefficient of lift at steady flight is the wing loading divided by the dynamic pressure, and the fact that lift and drag are closely related, it is easy to see how this parameter directly affects the thrust required to maintain flight.
Figure 4.3.1a shows a plot of thrust-to-weight versus wing loading, which provides an excellent tool for selecting these two design parameters. This figure shows the limiting segments of the mission: STOL operation and cruise. The conventional take-off and landing segments have negligible requirements compared to the STOL operation and are not shown. Each line represents the required values of thrust-to-weight and wing loading necessary to perform the mission segment with no excess thrust. For the STOL take-off, STOL approach and cruise, these lines represent the minimum values to operate. For the STOL landing ground roll, where thrust reversers are utilized (creating negative thrust according to the graph), the line represents the maximum value of thrust. Based on these requirements and other factors discussed in section 4.3.1 regarding engine selection, a specific engine model was selected, specifying the upper and lower bounds shown, with all engines operational and one engine out, referenced to initial take-off conditions.
Fig 4.3.1a Thrust-to-weight versus wing loading trade-study
4.3.2 Wing Loading
As mentioned in the previous section, wing loading is primarily a design parameter used and determined by the aerodynamic and structural requirements. The Falcor ATT has a wing loading of 61 psf with flaps retracted. The main purpose of an aircraft propulsion system is to overcome the drag, which directly links this key aerodynamic parameter to the thrust-to-weight ratio.

Fig 4.3.2a Contour plot of optimal wing loading at various flight conditions
There are several interesting facts that can be seen relating to the wing loading (see Figure 4.3.1a). The cruise thrust matching curve, which is shown decreasing with increasing wing loading, actually hits a minimum at higher wing loading values (an optimal value of wing loading). The optimal values are shown in a contour plot in Figure 4.3.2a. Notice that at the cruise condition of Mach 0.6 at 35,000 ft, the optimal wing loading is slightly over 100. Unfortunately, this is not very optimal for STOL operation. Since the Falcor is designed for STOL capability, there must be a compromise between the two condition requirements. Since there were no specified mission requirements for cruise, it is much easier to adjust cruise operation. Figure 4.3.1a shows the region in which the two driving conditions, STOL take-off and cruise, intersect. This point represents an excellent choice for optimizing the thrust-to-weight of the aircraft. The actual wing loading of 61 psf is somewhat lower than this convenient intersecting point. This lower-than-optimal selection of a wing loading results because of aerodynamic design limitations and mission performance considerations. Aerodynamically, the wing loading has an important effect on the drag of the aircraft, and there is a practical limit to the wing loading that can be reached (see section 3).
Fig 4.3.2b Effects of T/W and W/S on STOL take-off distance
The exact intersection is ideally an optimal point of operation, but does not account for the fact that the aircraft will be at full throttle, and will not be able to maneuver at all. By considering the performance of the aircraft, which is not accounted for in this trade-study, it essentially shifts these lines of operation up and to the left, resulting in a lower than expected wing loading.
Although the thrust-to-weight versus wing loading analysis is an excellent resource for initial analysis, it works best as a trade-study to consider the best combinations of wing loading and thrust-to-weight, rather than a method of pinpointing an exact value. Figure 4.3.2b shows a slightly different representation which demonstrates how a specific wing loading affects the STOL take-off distance with a given thrust-to-weight at take-off. The thrust-to-weight at take-off is directly related to the specific engine used, so Figure 4.3.2b essentially shows how various wing loadings affect the STOL operation given a particular engine. It is important to note that the thrust values used are uninstalled values. Also, the engine air bleed necessary for the active high lift system, which reduces the thrust available from the engine, is not taken into account. Although these are important reductions, the overall correction is not that significant in the initial design phase where this plot was utilized.
4.4 Engine Performance
The thrust and fuel consumption performance of the Falcor engines are an important characteristic to understand. It is especially important to analyze how the performance varies with altitude, speed and air temperature. Additionally, losses associated with installation and compressor bleed must be corrected for, which vary between different stages of the mission, particularly at STOL conditions.
4.4.1 Engine Specs
The Falcor ATT is powered by four High Bypass Ratio (HBR) Turbofan Pratt & Whitney F117-100 engines. The F117-100 is the exclusive engine used by the C-17 Globemaster, and offers a Fully Automated Electronic Digital Control (FADEC) system and reverse-flow thrust reversers that can be deployed in mid-flight [http://www.pratt-whitney.com/prod_mil_f117.asp]. This engine choice also fulfills Falcor’s requirement for an off-the-shelf derivative engine. The specifications of this engine are listed in Table 4.4.1a, along with the PW 2037 cruise data, which is the 37,000 lb commercial version of the F117-100.
A high bypass ratio engine was selected for the mission because it offers fuel-efficiency and large amounts of thrust without the use of afterburners. The penalty for combining these two performance characteristics is a larger inlet diameter and more weight. This was not a problem, since the fuselage and wingspan are both large as well, and the benefits of the fuel economy more than made up for larger size. The thrust level of the engine was selected based on the preliminary thrust-to-weight trade studies discussed in section 4.3.1. Several attractive characteristics of the Pratt & Whitney F117-100 engine are that it is the exclusive engine used on the C-17, which is advantageous for maintenance purposes. Also, this engine has advanced thrust-reversing capabilities, which are necessary for accomplishing a 750 ft landing on unimproved surfaces, where brake effectiveness will be significantly reduced.
Table 4.4.1a Engine Specs
4.4.2 Off-Design Performance
As seen in Table 4.4.1a, only the sea level static (SLS) thrust is given at standard atmospheric conditions (ISA). However, the Falcor mission includes segments at various flight conditions, including STOL operation at “hot and high” conditions (4,000 ft at 95 deg F), and a 35,000 ft cruise at Mach 0.6, both of which are key design conditions. The thrust from the engines vary with altitude and speed; the manner in which these variations affect the engine’s performance depend on the type of engine being used.
Figures 4.4.2a and 4.4.2b show how the thrust and thrust specific fuel consumption (TSFC) vary with altitude and speed at maximum throttle. Figure 4.4.2a exemplifies the difficulty in identifying general trends with altitude speed and thrust; for some altitudes thrust increase with speed, while at others it decreases. In fact, sometimes the thrust reaches a minimum, or changes concavity. Also, the ambient atmospheric conditions can have a significant influence on engine performance. There is a huge difference in the operation at “hot and high” conditions, which would behave very similar to 5,000 ft ISA at standard temperature. However, the Falcor’s engines lose large amounts of thrust (on the order of 20%) due solely to the increased ambient temperature. It is evident that precise analysis is important in determining the engine thrust at a given flight condition.
Figure 4.4.2a Uninstalled thrust lapse versus Mach number at max throttle
The TSFC behavior for the F117 is much more consistent than that of the thrust. As the Mach number increases, TSFC increases; alternatively, when altitude increases, TSFC decreases. At the “hot and high” condition shown, a higher ambient temperature tends to change the slope of the curve, so that the Falcor engines consume more fuel at higher Mach numbers.
Figure 4.4.2b Uninstalled TSFC versus Mach number at max throttle
To properly analyze the behavior of the F117-100 engine, an engine cycle model was created using Mattingly’s Perf engine analysis software. This software was utilized to analyze the off-design behavior of the Falcor’s engine. Perf is used to create a model of the F117 engine, and is then used to simulate a known operating condition, specified by the manufacturer. After matching this one point, Perf can be setup to iterate through a range of altitudes and Mach numbers, determining the fuel consumption and thrust values for each condition. Figure 4.4.2c shows a flow chart of the method of analysis.
Table 4.4.1a shows engine spec data for the F117 at SLS ISA conditions, as well as cruise data for the Pratt & Whitney PW 2037, the commercial version of the F117. The PW 2037 was used to identify the cruise performance, since there was no off-design data available for the F117. Often times manufacturers give much more limited spec data for military engines compared to commercial engines.
Figure 4.4.2c Perf analysis flow chart
Table 4.4.2a Engine cycle model values (Perf input)
Table 4.4.2a shows the specifications for the F117 engine cycle model created in Perf. Values for thrust, mass flow rate, overall pressure ratio (OPR) and bypass ratio (BPR) were taken directly from Table 4.4.1a. Note that the OPR is simply the product of the high-pressure compressor ratio (HPCR), low pressure compressor ratio (LPCR), and the fan pressure ratio (FPR). All other values were based on Mattingly, except for Tt4; recommended values given by Oates were used for p and h.
Tt4, the stagnation temperature of the turbine inlet, is a critical design parameter that is often the limiting factor of an engines thermodynamic performance. This value was not available through the manufacturer, but was instead obtained by varying Tt4 until it matched the expected cruise data. As illustrated in Figure 4.4.2c, this value was then used to create the off-design performance of the F117 over a range of altitudes and Mach numbers.
Perf was used in the manner described above to create Figure 4.4.2a. Although Perf also gives off-design TSFC values, the Perf model did not accurately describe the TSFC values specified by the manufacturer at any flight condition. This may be due to active fuel efficiency measures, such as the FADEC control system used on the F117. To provide an accurate measure of TSFC variation, empirical trends were employed. The empirical trend was modified by Wroblewski (based on Mattingly), and gives TSFC variation as a function of Mach number and temperature ratio.
Figure 4.4.2d F117-100 cycle derivatives at “hot and high” STOL operation
As discussed in section 4.4.2, various flight and ambient conditions can significantly affect the engine performance. One cannot expect to always encounter standard atmospheric conditions, which is of special concern to the Falcor mission. It operates within a combat zone, which could realistically occur in a wide range of climates. Figure 4.4.2d shows the cycle derivatives of the F117-100 at the STOL operating condition. These represent the sensitivity of various independent inputs, and how they affect the performance. The dimensionless derivatives tabulated on the right measure the relative sensitivity. These derivatives were obtained by making a slight perturbation to one of the independent inputs, and then finding the relative change in thrust and TSFC.
4.4.3 Cruise, Loiter and Climb Operation
The results of the off-design engine performance analysis discussed in the previous section describe the behavior of how different flight and ambient conditions affect the performance of the engine operation. It is also important to understand how this analysis fits into the bigger picture of the entire Falcor design. There are several additional factors that arise from this system interplay that affect the overall propulsion performance: engine throttling, installation losses, bleed losses and climb considerations.
As discussed in section 4.3.1, the thrust-to-weight is a key propulsion parameter used to describe the overall thrust in terms of the size of the aircraft. Figure 4.4.3a shows how the available thrust-to-weight varies with different flight conditions. Notice that the effects are the same as in Figure 4.4.2a, which shows the uninstalled thrust lapse variations.
In both cases, the engines are at full throttle, providing maximum thrust. Throttling an engine is done to produce level flight, which occurs where the thrust equals the drag, called thrust matching. Analysis of thrust matching is performed by calculating the drag-to-weight ratio, which gives the thrust-to-weight required. The equation used to calculate drag-to-weight at steady flight is taken from the aerodynamic analysis (see section 3). Throttling the thrust has an important influence on fuel consumption, as does the Mach number (see Figure 4.4.3b). Figure 4.4.3b is produced applying empirical analysis given by Raymer (pg. 392, equation 13.9). Note the significant increase in the Falcor’s fuel consumption at low speeds and altitudes that results from throttling. The cruise and loiter flight conditions were chosen to minimize these effects.
Figure 4.4.3a Available Installed thrust-to-weight variations with altitude and speed
Figure 4.4.3b Installed TSFC variations with altitude and speed
In addition to throttling, another decrease in performance arises from airflow losses. These come from two main sources: installation effects and bleed losses. The installation losses, which account for nacelle inlet losses, were determined by recommendations from Corke. Bleed losses due to air removed from the compressor for cabin pressurization are also determined by Corke’s recommendations. Both of these losses are relatively minor. Another form of bleed loss occurs at the STOL condition, due to the air bled from the engine for the internally blown flap (IBF) active high lift system. The effects of this form of bleed loss are discussed in section 4.4.4.
In the previous discussion of steady cruise and loiter flight, an initial assumption was made that the lift force was equal to the weight. For climb analysis, this assumption cannot be made. Instead, climb analysis is performed by energy methods involving the energy height and specific fuel energy, giving a minimum time to climb of 10.9 minutes and a minimum fuel to climb of 775 lb [Wroblewski]. Figure 4.4.3c shows the paths of minimum time and minimum fuel to climb in relation to lines of constant excess power and constant energy height. Figure 4.4.3d shows the same information for one engine inoperable (OEI). Notice that with one engine out, the Falcor must cruise at a slightly lower altitude and speed to have enough power to maintain level flight. The line where excess power is zero represents a limit in which the aircraft is using maximum power to maintain that flight condition. The minimum time to climb is determined by following the path where excess power is at a maximum for a given energy height; similarly, the minimum fuel to climb is determined by following the path where specific fuel energy is at a maximum for a given energy height [Wroblewski].
Figure 4.4.3c Excess power curves with all engines operable
Figure 4.4.3d Excess power curves with one engine inoperable (OEI)
4.4.4 STOL Operation
The primary mission requirement of the Falcor is its ability to perform a 750 ft (ground roll) take-off and landing at “hot and high” conditions on unimproved landing surfaces. This capability represents the primary challenge of the Falcor design. This is only feasible through the use of an active high lift system, which uses air from the engines to create high lift. The Falcor uses an internally blown flap (IBF) system, which ducts cool engine air through pipes in the wing to the flaps and slats. Due to the nature of the Falcor’s combat mission, the Falcor is capable of performing its STOL mission with one engine inoperative in a 600 ft ground roll.
The take-off condition for the STOL portion of the mission is significantly more limiting than landing, as is apparent from the thrust-to-weight versus wing loading trade-study in Figure 4.3.1a. The take-off analysis is based on a Raymer approach (p. 565, equations 17.101-103), derived from the simplified mechanics of an aircraft accelerating along a runway, but can also be applied to landing (viewing it simply as taking off in reverse). The mission requirements focus on a 750 ft. ground roll, rather the typical balanced field length take-off distance required for commercial aircraft. Solving for the T/W term in KT yields:
 (eq.
4.4.4a)
(eq.
4.4.4a)
In the case where Raymer’s landing equation is applied to landing, Vf is the touchdown velocity, and a negative sign appears in the exponent of e.
To produce a CLmax of 7.9 (which appears in the KA term in eq. 4.4.4a), the IBFs are turned on for STOL operation. IBFs are not the only form of active high lift devices that have been tested and demonstrated. Due to Falcor’s in-theater operation at extremely low airspeeds, maintaining a low IR signature was a consideration. Other active high lift systems, such as the upper surface blowing used on the YC-14 or the externally blown flaps of the C-17, would be potentially dangerous in a combat situation during take-off or landing situations because of the high heat signatures.
IBFs were further justified by interpretation of Boeing test data performed on various forms of active high lift (see Figure 3.5.2a). From these results, IBFs were found to be the most efficient form of active blowing, not including the ducting losses.
To determine the actual overall propulsive efficiency of the IBF system based on the Boeing lab data, the performance of the IBFs must be evaluated relative to theoretical minimum and maximum drag values. The theoretical maximum drag is parasitic drag plus induced drag, the value that would be obtained without any blowing. When blowing is used, the amount of lift and drag created varies with the angle the jet of air is directed over the flaps. The theoretical minimum drag occurs at a particular angle, which can be found by differentiating CD with respect to the jet angle qj. With an initial coefficient of lift CL,I , the coefficient of drag with blowing is given by:
 (eq.
4.4.4b)
(eq.
4.4.4b)
Where the blowing coefficient Cj = 2, and Sw/S is the ratio of the wing area with active high lift.
Differentiating Equation 4.4.4b with respect to qj, setting the expression equal to zero and solving for qj, one obtains an expression for the jet angle producing minimum drag:
![]() (eq.
4.4.4c)
(eq.
4.4.4c)
Using the same relative efficiencies obtained from the Boeing test results, a high lift drag polar is created using the Falcor aerodynamic value of k (see section 3) to obtain the line of 100% efficient blowing (minimum drag line). This result is illustrated in Figure 4.4.4a. Notice that both internally blown flaps and externally blown flaps (also used with Pratt & Whitney F117-100 engines on the C-17) are shown. IBFs were utilized because they operate much more efficiently and delay stall, allowing higher coefficients of lift to be attained.
Figure 4.4.4a Falcor high lift drag polar comparing IBF and EBF systems
As mentioned in the Boeing test results, the IBFs tested does not include efficiency losses due to pipe flow loss in the ducting system. A generic ducting system was determined to be approximately 89% efficient, shown in Figure 4.4.4b. A fully designed ducting system, which was determined to be beyond to scope of the Falcor design mission, could easily be made more efficient through optimization.
The ducting was analyzed using the generic layout depicted in Figure 4.4.4b using stagnation pressure loss for compressible flow given by Oates (p. 45, equation 2.81) and flow loss factors for various ducting devices given by Munson (p.489, Table 8.2). With this, applying the definition of the loss factor KL (pressure drop divided by dynamic pressure), pressure loss for a given flow speed can be related. Subsonic flow property tables were utilized to expedite the calculations involving compressible flow [Kuethe and Chow, 1998]. The results of the analysis are tabulated in Table 4.4.4a.
Figure 4.4.4a Generic ducting layout (side view)
Table 4.4.4a
The compressibility of the air through the ducting system is determined largely by whether the air is ducted directly from the compressor (core-bleed method), or taken from the bypass exit flow (fan-bleed method). As seen in the thrust-to-weight trade-study in Figure 4.3.1a, one can see that the fan-bleed model is slightly more effective, since the percent-flow removed for the blown flaps is much less. However, this system requires further development and design, including a retractable scoop for the bypass air. Therefore the Falcor currently uses the more traditional core-bleed system, until further analysis and design can be done on the fan-bleed method.
4.5 Summary
The propulsion system of the Falcor has been designed to meet the power and thrust needs at each point of the mission, while providing adequate performance to face the danger of operation in and around a combat zone. The needs of the critical STOL portion of the mission are met with the Falcor IBF system, which was designed through an approach combining a variety of flow theory, non-ideal engine cycle modeling, and empirical high lift and engine data. This multifaceted approach to the complex design challenges provided important data unique to the Falcor, which was confirmed by the overlap of each method of analysis.
5. Stability & Control
5.1 Introduction
The Falcor ATT’s capability of taking off in distances of 750 feet is made possible by its variable incident wings and high lift devices. The Falcor’s structure configuration was carefully adjusted to accommodate these features. The STOL take-off is considered to be the number one objective for the design. The analysis focuses on STOL take-off and cruise. Although, the control authority at take-off is uncertain, the following analysis will show that the Falcor will have good control during the cruise phase.
5.2 Methodology
Microsoft Excel and Visual Basic
were used to keep track of all the inputs [StabilityInputs.xls in e-ppendix].
There were many variables based on prior analysis done in other sections:
particularly in Aerodynamics, Propulsion, and Weight Analysis. The approach
used to analyze longitudinal and lateral static stability, sizing of control
surfaces, trim analysis, and rotation analysis are all based on Corke, Etkins
and Reid, Nelson, Raymer, and Wroblewski. The trim analysis at take-off has
some variables that are unique to the Falcor, however, overall approach is
still the same. Stability derivatives were calculated based on Advanced
Aircraft Analysis (AAA) equations and Nelson (pg. 121), but AAA software was
not used to verify these values. AAA software takes into account things that
are hard to estimate at this level of analysis. Rather than making more
complicated estimates of the derivatives, the analysis was simplified, where
the only dominant terms were considered. 

Figure 5.2 a Flow Chart Showing the Relationship of Different Analysis
5.3 Static Stability
Static stability tells whether the aircraft can regain steady state without control surfaces if there is a disturbance during the flight. The following analysis will show that the Falcor has good static stability during flight in the longitudinal direction and has static stability in yaw and roll direction but may not be sufficient enough when there are disturbances.
5.3.1 Longitudinal
The goal of longitudinal analysis is to attain negative coefficient of moment relative to change in angle of attack (Cma) and to achieve a static margin (SM) of 5% to 25% at all phases of mission. SM value can change drastically with shift in center of gravity (CG) and these effects are discussed in more detail in the following sections. The challenge of longitudinal static stability is taking into account of the wing aerodynamic center (Xac) shift due to the use of high lift devices and its effect on the static margin at take-off. In addition, Cma is driven to a larger negative value. As SM and - Cma become larger, control authority will decrease and more pilot input will be required.
5.3.1.1 STOL Take-Off
The Xac shifting aft due to the use of high lift devices causes problems during trim-take-off, which leads to difficulty with the trim analysis. These will be discussed more in detail in [5.4.1]. The shift in Xac also causes the aircraft to have a higher static margin; this means that the control authority becomes more sluggish and more effort is needed by the pilot during take-off. To counter this effect, the fuel weight was shifted to move the CG aft as well. This fuel movement helps reduce the moment arm between Xac and CG and therefore reduces the SM. The idea is to pump 13,000 lbs of fuel during take-off and shift the CG aft. With ground effects (10% increase in wing lift coefficient (CL) and reduction of downwash effect) and moment arm reduction taken into account, and by the use of new CG points obtained through CG analysis [2.3], the following results were obtained using methods in Wroblewski.
Table 5.3.1.1a Results of STOL T/O NP and Cma
|
|
|
STOL Take-off |
||
|
|
Xcg ft from nose |
Cma |
Xnp ft from nose |
SM |
|
Full Fuel No Cargo/Cargo on CG |
74.845 |
-4.200 |
88.102 |
63.280 |
|
Mininmum Fuel for STOL Full Cargo |
76.427 |
-3.656 |
88.102 |
55.730 |
|
Full Fuel Full evenly spread cargo (Cargo CG = 80ft) |
76.367 |
-3.676 |
88.102 |
56.016 |
The three configurations described in Table 5.3.1.1a are the Falcor can attain STOL take-off. When the aircraft has less than 13,000 lbs of movable fuel, the CG shift is not enough to attain trim during take-off therefore it will not be considered.
There are also high Cma values across the board. This becomes a problem as Angle of Attack (AoA) increases, because the Falcor’s tendency is to pitch down too much. The Falcor is designed to take-off with zero AoA and will not pitch up until enough airspeed is gained [5.6]. These values also show that if the Falcor was to have some disturbance input, it may become dynamically unstable. Because of the Falcor’s large size, the disturbance must be considerable to drive it dynamically unstable at take-off. It is hard to imagine that there will be enough gust in the longitudinal direction to make this situation possible.
Fig. 5.3.1.1a Static Margin vs Xac Location From Nose at Take - Off
The effect of aerodynamic center shift is shown in Fig. 5.3.1.1a. As the Xac moves back, the SM becomes significantly higher. Even when the CG is shifted with the fuel pump mechanism, the SM is much higher than the recommended. The high SM value at take-off condition means that the control of the aircraft will be sluggish. There will be some delay for aircraft reaction time to the pilot’s inputs. At take-off, the sluggishness is not a major factor, for there is no need to pitch up. The airplane has so much lift due to variable incident wing that Falcor will take-off level [5.5.1].
5.3.1.2 Cruise
With the flaps retracted, internal blowing flaps (IBF) inactive, fuel shifted back to the original location, and no more ground effects, the following results were obtained using methods in Wroblewski.
Table 5.3.1.2a Results of Cruise NP and Cmα
|
|
|
Cruise |
||
|
|
Xcg ft from nose |
Cma |
Xnp ft from nose |
SM |
|
Empty CG Location |
70.862 |
-0.864 |
73.872 |
14.368 |
|
Full Fuel No Cargo/Cargo on CG |
70.591 |
-0.941 |
73.872 |
15.661 |
|
Minimum Fuel for STOL Full Cargo |
70.784 |
-0.886 |
73.872 |
14.740 |
|
Full Fuel Full evenly spread cargo (Cargo cg=80ft) |
73.369 |
-0.144 |
73.872 |
2.401 |
In most configurations, the Falcor is a stable aircraft. With Cma at small negative value and the static margin within the recommended value (5%< SM < 25%) [Wroblewski Static Stability], it is a statically stable aircraft. Although the SM at “Full Fuel Full Cargo” configuration is low, the Falcor will have enough control authority to overcome any problems [5.8.2].
5.3.2 Yaw and Roll Stability
The total lateral and directional stability should ideally be positive without the control surfaces. Because of layout and design choices made in previous sections, the Falcor will need control surfaces large enough to overcome destabilizing effects in order to achieve the yaw and roll stability.
5.3.2.1 Yaw Stability
Using Raymer, wing and fuselage stability derivatives with respect to yaw directions were calculated. The Cnbw and Cnbfus are function of lift, wing geometry and fuselage dimensions respectively, therefore cannot be varied. The values for cruise and take-off are shown in Table5.3.2.1a.
Table 5.3.2.1a Yaw Stability Coefficients
|
Yaw |
Cruise |
T/O (STOL) |
|
|
Wing |
Cnbw |
0.003 |
0.915 |
|
Fuselage |
Cnbfus |
-0.122 |
-0.122 |
|
SUM |
-0.119 |
0.793 |
|
The Cnbw at take-off is very large because it is a function of lift and at STOL take-off, the CL is 7.9. The only concern here is what happens if an engine fails. Cnbw may go down slightly, due to decrease in CL, but the value should still maintain a high Cnbw value. However, there is still concern of where these forces will act. IBF depends on the air bleed from the engines. If that goes out at different locations, there may be twisting motion resulting from it. The same concern goes for roll stability. This is something very complicated to analyze without any experimental data. For now, Falcor will assume that it will have yaw stability at take-off, even with OEI.
The
requirement for yaw stability is Cnb
> 0. The recommendation for Cnb
for a cargo airplane cruising at M=0.6 is approximately 0.15 [Corke 2003, pg.
273]. 
Fig. 5.3.2.1a Cnb vs Surface Area of Vertical Tail
The total Cnb at cruise is far less than what is recommended. The Falcor has vertical stabilizers which will add yaw stiffness to make it stable; however, the value is far smaller than what is recommended. To attain the recommended value of 0.15, the surface area of the vertical stabilizer must be significantly higher. This comes with the cost of increased weight and drag [3.4.1]. It is shown in section 5.8, failure to meet the recommended values results in failure to meet the flying qualities and the Falcor will be dynamically unstable. The Falcor has enough control surfaces so that even when it becomes dynamically unstable, it will be able to regain stability with implementation of control actuator.
5.3.2.2 Roll Stability
The roll stability derivatives with respect to roll motion values were obtained using Raymer method. Again like yaw stability derivatives, Cldvs and Clbw, are functions of lift, wing geometry and tail geometry respectively. The vertical tail (VS) geometry was defined by the aerodynamics engineer while being sufficient for yaw stability [3.4.1 and 5.3.2.1].
Table 5.3.3.2a Roll Coefficients
|
Roll |
Cruise |
T/O (SSTOL) |
|
|
Wing |
Clbw |
0.081 |
-0.282 |
|
VS |
Clbs |
-0.060 |
-0.060 |
|
Sum |
0.021 |
-0.375 |
|
The Roll Stability requirement is Clb > 0 and the recommended value is approximately half of recommended Cnb value for subsonic aircrafts (Clb ≈ .075) [Raymer,1999]. At cruise, the Falcor is stable but again fails to meet the recommended value. Again, the Falcor will be dynamically unstable without control surfaces and will be statically and dynamically unstable at take-off. At take-off, the roll coefficient for the wing is a large negative value that is due to the fact higher lift causes destabilizing effect.
5.4 Control Sufrace Sizing
5.4.1 Elevators
The sizing of the elevator will be based on CL tail required at the trim take-off, which is in the region of -1.9 to -2.3. This analysis was done in the aerodynamic section [3.4.1]. In effect, the elevator acts like a large split flap on the horizontal tail.
5.4.2 Rudders
The rudders were sized based on a strong gust situation during cruise. This is because the Falcor is very stable at take-off due to its high coefficient of lift. The method used takes the Cnb at cruise and uses Corke’s method of sizing rudders for take-off conditions. As mentioned in section 5.3.3.1 the Cnb at cruise is 0.018; the rudder was based on this value at cruise and OEI or high cross wind take-off. Although Falcor has very powerful engines, an OEI conditions is not too large of a concern as one would think for a 4-engine aircraft. The OEI analysis is done with an assumption that one of the outer engines is out. This is because the inboard two engines are attached to the fuselage, and even if one of these engines goes out there will be no significant moment created as compared to the outer engine out situation. However, the additional force needed in the yaw direction is far less at an OEI condition compared to the crosswind take-off condition. The percentage of rudder area recommended for this aircraft was approximately 5%; however, for safe measures the rudder is sized based on 15% of the tail area.
5.4.3 Ailerons
The sizing of ailerons was done based on maximum aileron space allowed, 30%. This value was limited by flap space. Using standard equations given in Nelson (pg. 84), the following results were obtained for the two mission phases.
Figure 5.4.3a Aileron Deflection vs Total Roll Coefficient
The aileron effect at take-off is not quite enough to stabilize the aircraft according to the analysis. This value is obtained through the assumption that this is a clean wing. At take-off, the IBF system bleeds the air over the flap. This means that there are moments generated in the roll direction. There are also other forces of thrust vectoring from blown flap, thrust that is vectored due to the rotation of the wing, all of which contributes to the roll moment. However, since no data on the characteristics of air blown over the flap exists, there is no concrete method of accounting for roll due to IBF and other high lift devices. It will be assumed that the lift generated by these forces will compensate for the lack of aileron control authority at the take-off.
5.5 Trim Analysis
5.5.1 Take-Off
The take-off trim analysis is very difficult to keep track of because there are so many different variables to consider. The approach is a standard trim analysis with a few additional terms and characteristics added. Ground effect, Xac shift and additional lift elements from high lift devices [3.5], were some of the key characteristics added to basic analysis. Table 5.5.1a and Figure 5.5.1a represent the variables to be considered.
Table 5.5.1a List of Moment Elements @ STOL Take-Off
|
|
Moment Element |
+ / - Pictch |
|
|
1 |
Lift from Wing |
- |
|
|
2 |
Wing Moment |
- |
|
|
3 |
Flaps |
- |
|
|
4 |
Fuselage |
- |
|
|
5 |
Vectoring |
- |
|
|
6 |
IBF |
- |
|
|
7 |
Thrust (Y) |
+ |
Engine (Rotating) |
|
8 |
Thrust (X) |
- |
|
|
9 |
Inlet Normal (X) |
+ |
|
|
10 |
Inlet Normal (Y) |
+ |
|
|
11 |
Thrust |
+ |
Engine Fixed |
|
12 |
Inlet Normal |
+ |
|
|
13 |
Tail |
- |
|

Figure 5.5.1a Illustration of Moment Elements Around CG
Locations of elements 1, 5, and 6 were determined in aerodynamics [3.5.3]. The analysis assumes that the wing’s rotation will be limited between 28 to 34 deg. This assumption is followed by another assumption that as the wing varies its incident, the variance of position where 7,8, 9, and 10 will act is minimal. Elements 7, 8, 9, and 10 are function of incident angle, iw. This is because inlet normal force and thrust varies with the rotation and if it acts at the angle, there must be two forces which both contribute to the total moment about the CG point. Also, in this analysis, the lift element due to vectoring is altered in order to take in the account wing rotation.
The new equation for vectoring is: ![]()
Since there is no
equation for the lift force of IBF, lift is approximated by the following
equation: ![]()
· Cl max = 7.9 from Propulsion Analysis
· (1.1) term comes from calculation of take-off velocity.
· Cl, vector and Cl, le both from aerodynamics [3.5.2].
With these elements considered, the rotation angle can be calculated. However, another variable that is a limiting factor is how much negative lift the tail can produce to counter the tremendous lift produced by the wing and high lift devices. Due to the use of IBF and high lift devices, the Falcor has a tremendous amount of pitch down moment. To counter this, the two inboard engines are fixed to the fuselage. By not rotating and ideally placed below the center of gravity in Z direction (Zcg) the two inboard engines produce pure positive moment as a result. Also, the fuselage was extended to accommodate a tail with longer moment arm and the fuel shift technique was incorporated to reduce the moment arm for the lift elements 1, 5, and 6. Figure 5.5.1b shows the relationship between Xcg and position of horizontal tail, Xh.
Figure 5.5.1b CL Horizontal Tail vs Xcg Location from Nose
From aerodynamic analysis [3.4.1], -2.3 is the maximum negative coefficient of lift that can be produced by the tail. The current configuration places the tail at 175 ft from the nose. The take-off CG is between 74.9 ft and 76.4 ft, which is well within the minimum CG requirement of 74.3 ft. The placement of the CG is a crucial task for the load master each time the Falcor takes off; otherwise, as seen from this plot, it may not take-off if the CG is off by as little as 0.5 ft.
5.5.2 Cruise
The trim analysis at cruise has two goals:
1) find the iw (incident angle of wing)
2) find AoA (angle of attack) needed to attain trim at all phases of cruise.
The incident angle was found at the end of cruise 2, which has the lowest wing loading (W/S), due to the fuel burn. This will prevent the aircraft from having any negative AoA at any phase of the mission. The iw found at this condition will also be the value after the wing rotates back into the place. The following results were obtained using standard methods from Wroblewski .
Table 5.5.2a Results of Trim Analysis @ Cruise
|
Wing Loading |
end cruise 2 |
Wing Loading |
Beg cruise 1 |
end cruise 1 |
beg cruise 2 |
|
50.4700 |
59.7800 |
56.6800 |
53.2400 |
||
|
CL, h |
0.0811 |
CL, h |
0.1109 |
0.1010 |
0.0900 |
|
iw (rad) |
0.0223 |
AoAw(rad) |
0.0130 |
0.0087 |
0.0039 |
|
iw (deg) |
1.2788 |
AoAw(deg) |
0.7472 |
0.4984 |
0.2223 |
|
de (rad) |
-0.0213 |
de (rad) |
-0.0191 |
-0.0188 |
-0.0185 |
These results show that the Falcor can fly at a minimum angle of attack, which is easing to the passengers of the Falcor.
Figure 5.5.2a CD Comparison
As the AoA increases, the additional drag due to trim become more substantial. However, the change is minimal.
5.6 Rotation Analysis
The rotation analysis demonstrates how much the aircraft must rotate to attain the same amount of lift at climb but without the use of high lift devices. The analysis is similar to an aircraft pull up maneuver analysis in Etkin and Reid (pg. 60). The following is a trade-study of how much the aircraft must rotate with the how much the elevator must deflect.
Figure 5.6a AoA and Elevator Deflection Angle v.s. Climb Speed
As one can see, as the airspeed increases the angle of attack required becomes smaller. This shows that the airspeed must be increased before high lift devices are retracted and the wing is rotated back to its original incident angle.
5.7 Stability Derivatives
Using the equations in AAA theory section, Nelson (pg 212), and values obtained from previous analysis, the Falcor’s stability derivatives were obtained. These are considered to be an initial estimate to see where the Falcor stands dynamically. An assumption the analysis makes is ignoring the propulsion effects, because they are complex and are relatively small compared to other components. The analysis will only consider phase end Cruise 2 and ‘Full Fuel / Evenly Spread Cargo (Xcg = 73.369 ft)’ configuration. This should be the most vital since it’ll most likely be the configuration most often used and will give general cruise dynamics.
The dynamics at take-off will be complex because IBF affects on stability derivatives are unknown. Also, as mentioned earlier, the take-off stability should be a very stable [6.4.3].
Table 5.7a Stability Derivatives Longitudinal Direction
|
CL |
CD |
CLa |
CDa |
Cma |
CLa˙ |
CDa˙ |
Cma˙ |
|
0.4104 |
0.0382 |
5.2139 |
0.1626 |
-2.0306 |
0.0585 |
0.0000 |
-16.254 |
|
CLq |
CDq |
Cmq |
Clu |
Cdu |
Cmu |
Clde |
Cmde |
|
8.5078 |
0.0000 |
-48.021 |
0.2202 |
0.1098 |
0.0000 |
0.9767 |
-4.7115 |
Table 5.7b Stability Derivatives Lateral Direction
|
Cyb |
Clb |
Cnb |
Cyp |
Cyr |
Clp |
Cnp |
|
-0.1586 |
0.0209 |
0.0179 |
0.0589 |
0.3212 |
-0.6597 |
-0.0513 |
|
Clr |
Cnr |
Clda |
Cnda |
Cydr |
Cldr |
Cndr |
|
0.0479 |
-0.6752 |
0.3633 |
-0.0298 |
0.0756 |
0.1326 |
-0.1068 |
Table 5.7c Class I Moments of Inertia Estimates [Raymer, 1999]
|
Ix |
1.63E+07 |
Slug ft2 |
|
Iy |
3.50E+06 |
Slug ft2 |
|
Iz |
1.73E+07 |
Slug ft2 |
|
Ixz |
0 |
Slug ft2 |
5.8 Dynamics and Control Implementation Examples
In this section, the analysis will verify the static stability analysis by plotting transient response to small disturbances. Results show that the Falcor is stable in the longitudinal, but in the lateral direction, the Falcor lacks the stiffness to retain steady state. In this section, the analysis will give two examples of controller implementation to show that controlling the Falcor is feasible given present controller surfaces.
5.8.1 Flying Qualities
The Falcor dynamic performance is compared to the MIL-F-8785C specifications. The following is the category and flight phase that the Falcor will be compared against.
Class III: Large, heavy, low to med. Maneuverability airplane (heavy transport/cargo/tanker).
Class B Non-terminal flight phase):
Accomplished using gradual maneuvers and w/o precision tracking, although accurate flight path control may be required (climb, cruise, loiter, in flight refueling, decent).
Level I: Flying qualities clearly adequate for the mission flight phase
Level II: Flying qualities adequate to accomplish the mission flight phase but with some increase in pilot workload and / or degrading in mission effectiveness or both
Using Matlab and standard definition of stability equations, the following were obtained.
Table 5.8.1a Flying Qualities Longitudinal
|
|
|
Phugoid |
Short |
|
|
|
|
z |
z |
|
|
|
|
Min |
min |
Max |
|
MIL-F-8785C |
Level 1 |
0.04 |
0.300 |
2 |
|
Level 2 |
0 |
0.200 |
2 |
|
|
Falcor |
0.1447 |
0.7654 |
||
Table 5.8.1b Flying Qualities Lateral
|
|
|
Dutch |
Roll |
Spiral |
||
|
|
|
z |
z wn |
wn |
Max Time Const |
Min Time to Double |
|
|
|
At least |
at least |
at least |
Max |
Min |
|
MIL-F-8785C |
Level 1 |
0.080 |
0.15 |
0.4 |
1.4 |
12 |
|
Level 2 |
0.020 |
0.05 |
0.4 |
3.00 |
20.00 |
|
|
Falcor |
0.994 |
0.987 |
0.9964 |
3.8742 |
11.302 |
|
Longitudinal flying qualities are met, but roll and spiral mode in lateral direction qualities were not met. These will show up as a divergence in dynamics. They represents that the Falcor does not have sufficient lateral/directional stability. The control surfaces sized in section 5.4 will be sufficient enough to overcome this problem.
5.8.2 Longitudinal Dynamics
Using Matlab and solving for standard small disturbance theory the following transient response with initial disturbance was obtained.
5.8.2.1 Transient Response with Initial Conditions
This plot shows how the aircraft reacts to the small disturbance, the initial conditions. From the plot, one can see that speed, u, and angular velocity, q, never reach the steady state. In general, there is not enough damping. The time it takes to settle is almost 6 minutes for each response. Although flying qualities are met, these responses can improve in performance.
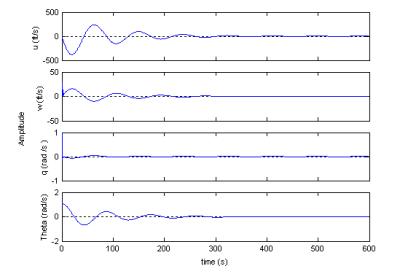
Figure 5.8.2.1a Transient Response with Small Disturbance Initial Condition
5.8.2.2 Analysis of Feedback loop
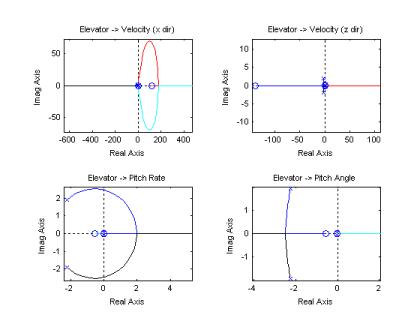
Figure 5.8.2.2 a Root Locus Plots with Elevator Input
The root locus plot is used to analyze the negative feedback loop. By varying the feedback gain, K, one can vary properties of how the response varies. By looking at the four outputs (u, w, q, and theta), the root locus plot for elevator input to velocity (x-dir) drive towards instability (goes to right hand side) with a very small gain. The root locus plot for the propulsion controller is not represented, because we are assuming that we are not going to depend on a propulsion controller.
5.8.2.3 Speed (U) controller with Elevator Input, Gude
The current relationship between speed (x-dir) and rudder input is given by the following transfer function:
-15.78 s^3 - 9.434 s^2 - 0.2578 s + 9.714e-017
Gude = ------------------------------------------------------------
s^4 + 4.533 s^3 + 8.789 s^2 + 0.2087 s + 0.04676
For simplicity, Single Input Single Output (SISO) closed loop controller was used.
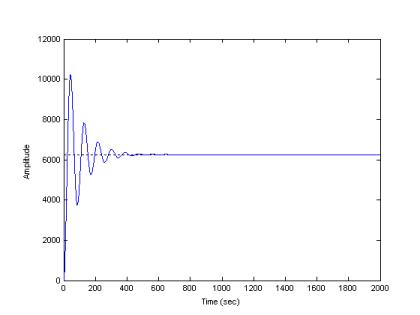
Figure 5.8.2.3a Step Input to Gude
By looking at step response of the function Gude, it is confirmed that it has high overshoot, small damping, and high steady state error. Therefore, the objective of controller implementation is to:
a) Reduce overshoot, decrease settling time, and eliminate steady state error.
b) Drive the system to left hand side so it will not go unstable with increase in gain.
c) Meet Flying Qualities
By applying close loop technique as well as Proportional, Integration, and Derivative (PID) controller technique we can get a better performance.
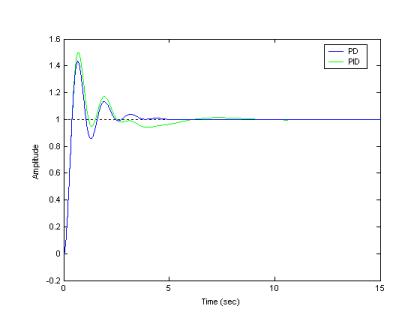
Figure 5.8.2.3b Step Response After Controller Implementation
Surprisingly the Proportional Derivative (PD) controller gives a better result. There is no need to go to PID controller which is more expensive and hard to apply. The following gains were used for PD controller: Kp = .1 and Kd = .1. (When PID was applied Ki = .1 was used). This shows that the sizing for elevator was sufficient provided that PD controller was applied. In reality, the Falcor will need a much more complex control program.
Table 5.8.2.3a Flying Qualities after Controller Implementation
|
|
|
Phugoid |
Short |
|
|
|
|
z |
z |
|
|
|
|
Min |
min |
max |
|
MIL-F-8785C |
Level 1 |
0.04 |
0.300 |
2 |
|
Level 2 |
0 |
0.200 |
2 |
|
|
Falcor |
0.1447 |
0.7654 |
||
|
w/ PD Controller |
0.237 |
0.9048 |
||
5.8.3 Directional Dynamics
5.8.3.1 Transient Response with Initial condition
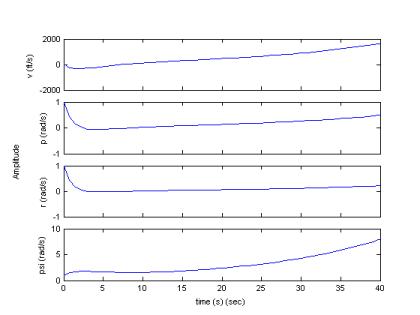
Figure 5.8.3.1a Transient Response of Lateral Motion with Initial Condition
The Falcor’s response is a divergent. Since there is no oscillation, this implies that the Falcor has insufficient directional or roll stability. Oscillations usually result from too much directional and lateral stability. Non-oscillating divergence means that either roll or spiral mode is unstable because the eigenvalues are real. This result makes sense because flying qualities did not meet either roll or spiral mode while it met dutch mode specs.
5.8.3.2 Feedback Analysis
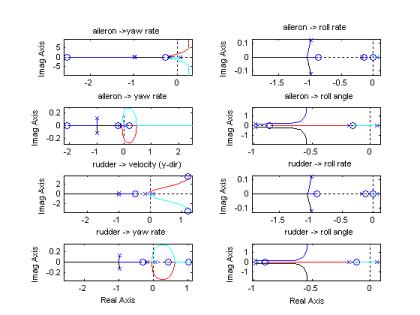
Figure 5.8.3.2a Root Locus for Lateral Dynamics
From the root locus plot, it is evident that each system has an unstable spiral mode, represented by a smaller positive root. Again, the tendency here is the same as longitudinal feedback analysis; given small increases in gain, they all go to unstable.
5.8.3.3 Roll Angle (f) controller with aileron Input, Gfda
The transfer function relating roll angle to the aileron input is:
8.882e-016 s^3 + 0.2328 s^2 + 0.2359 s + 0.02939
Gfda = ------------------------------------------------------
s^4 + 2.099 s^3 + 1.218 s^2 + 0.09541 s - 0.01093
Controller goal is to:
a) Stabilize the system
b) Meet the flying quality specifications.
Same method used in speed controller in [6.7.1.3] will be used.
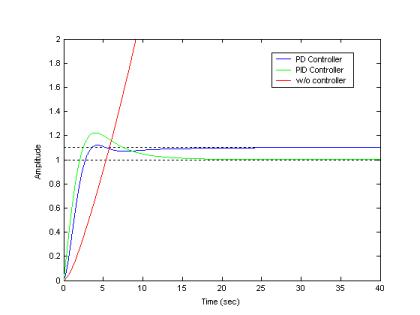
Figure 5.8.3.3a Step Response With Controller Implemented
This time, a more expensive PID controller must be implemented; otherwise the steady state error will not be eliminated. The gains used are: Kp= 5, Ki = 1, and Kd = 2.5. The PID controller stabilizes the system and gives good damping, as seen by it’s fast settling time. The PID controller also met its flying quality specifications.
Table 5.8.3.3a Flying Qualities after Controller Implementation.
|
|
|
Dutch |
Roll |
Spiral |
||
|
|
|
z |
z wn |
wn |
Max Time Const |
Min Time to Double |
|
|
|
at least |
at least |
at least |
Max |
Min |
|
MIL-F-8785C |
Level 1 |
0.080 |
0.15 |
0.4 |
1.4 |
12 |
|
Level 2 |
0.020 |
0.05 |
0.4 |
3.00 |
20.00 |
|
|
Falcor |
0.994 |
0.987 |
0.9964 |
3.8742 |
11.302 |
|
|
w/ PID Controller |
0.620 |
0.6196 |
0.8022 |
0.9914 |
44.14 |
|
5.9 Summary
Many aspects of the Falcor’s stability and control issues were reviewed in this section. Overall, the Falcor is a stable aircraft in the longitudinal direction and stable enough in the lateral direction. The control surfaces were sized large enough so that with help from a controller actuator, the Falcor can regain stability. The stability and control issue during the take-off condition was briefly examined during the trim analysis. However, IBF is a technique that is hard to analyze and predict. This would require sophisticated controller. The overall analysis shows that the Falcor is a feasible aircraft to stabilize and control.
6. Structures
6.1 Introduction
The structural aspects of the Falcor, are for the most part, dependent on the aerodynamic and stability parameters. The structure is a design based on the weight and layout constraints. The load estimates are the most critical. They determine the entire result of the structural analysis. All values must incorporate the ever so important “design” or “limit” load factor of 3.75 and 2.5 respectively. The external configuration has been determined; the following is an analysis of the internal structure of the Falcor.
6.2 Methodology
The entire analysis was performed using Microsoft Excel, Autodesk Inventor, and paper and pencil. The fuselage analysis was performed using the method described in Corke, and Niu. John McNally, Subsea engineer for Exxon Mobil, was a reference in the fuselage analysis. The wing and tail spar analysis utilized the equations from the “Structures” lecture [Wroblewski]. The ribs are based on the description and example of another transport aircraft, L-1011 [Niu, 1997].
For the load factor, three sources were consulted in attempts to clarify inconsistencies: Corke, Niu, and lecture notes: Wroblewski. The choices of materials are taken from suggestions in Raymer. The process for most of the analysis was based on trial and error. The results were compared to either accepted values or fixed design criteria.
Figure 6.2a Shared information flow chart.
6.3 V-n Diagram
The V-n diagram served as a preliminary guideline for Falcor’s structural analysis. A vertical gust during the cruise segments of the mission causes the largest load the aircraft would experience. The V-n diagram (Figure 6.3.1a) displays how gust loads affect the Falcor for various parameters, such as stall and dive velocities. These evaluations determine limitations for flight operation. Ultimately, the results of this analysis allow one to determine a sound value for the design load factor by making certain the aircraft can withstand an appropriate range of gust loads.
6.3.1 Gust Load Effects
The strongest gusts occur at cruise, or 35,000 feet. Therefore, the maneuver envelope for the V-n diagram requires all velocities to be “equivalent” velocities (Ve). As altitude increase, density decreases and the dynamic pressure changes. The equivalent velocity takes this into account by utilizing the ratio of the density at flight to sea level density:
![]()
An aircraft’s ability to stay in the air depends on the stall speed. A V-n diagram allows one to see if a gust load would force the aircraft to below its stall speed. The Falcor is equipped with a very large wing meaning a large planform area translating to a large planform area for gust loads to act. This creates a large force on the structure. All structural components must be designed according to the large impact of these gust load factors. The following is a representation of Falcor’s maneuver envelope:
Figure 6.3.1a V-n Diagram
6.3.2 Total Envelope
The parameters defined by the gust loads and stall speeds create the maneuver envelope. The upper limit is set by the “load limit” factor. This number is based on a standard value for transport aircraft. In order to account for safety, the design load limit is multiplied by 1.5. The Falcor’s design load factor of 2.5 with 40 ton payload exceeds the military requirements of 2.25 with a 40 ton load. For Falcor, the limit load factor is 3.75. This is used in each analysis to ensure absolute safety and structural robustness. The negative load factor is n = -1. This, again, is a standard value. It is less in magnitude than the positive load factor, and therefore is not as important in the design process.
6.4 Fuselage Design
The fuselage is a semi-monocoque design, without stringers. The fuselage consists of six longerons and many formers placed every eighteen inches along the length of the fuselage between the cockpit and the aft most end of the cargo area. The suggested distance between formers is fourteen inches. Bulkheads cannot be used on the cargo section of the fuselage: it must remain open and unobstructed for cargo. All cargo will be loaded via a ramp located in the tail, which prevents the use of bulkheads in the aft portion of the aircraft. There is, however, one bulkhead at the end of the cone in the nose, in front of the cockpit. This creates a problem for pressurization. In the absence of pressure bulkheads, all doors, windows and other openings must be fully sealed in order to pressurize the cabin and cargo area.
The formers are used to decrease the unsupported length of the longerons. This increases the amount of compressive load the longerons can withstand, and consequently allows for a smaller radius. A compromise in weight between the spacing of the formers and the number/size of the longerons was reached. This is because they are needed to “form” a three dimensional frame that shapes the fuselage skin. Loads on the fuselage cause it to bend and torque. This places the fuselage half in compression and half in tension. Longerons carry the load due to compressive stress, where the skin is responsible for supporting the tensile loads.
6.4.1 Longeron Sizing
The formers are considered rigid enough to restrain the longerons. The constant C, related to longeron support at former-longernon joints, was chosen to be 1.5 (where C = 1; pinned ends, and C = 4; fixed ends) [Corke, 2003]. Structural failure due to compression results in buckling of the members. To prevent this, the compressive stress of the combined longerons multiplied by the design load factor must be less than buckling stress of a desired material. The bending moment for a positive load factor causes the lower section of the fuselage to experience compressive stresses; negative loads cause tensile stresses [Corke, 2003]. To account for both situations, longerons must be placed equally around the fuselage.
Figure 6.4.1a Longeron spacing: 1.5 per 90-degree segment.
The radius of each longeron is one inch. The maximum unsupported length this longeron configuration can support is just over ten feet. However, if they were to be placed that far apart, the skin would not have anything to be attached to. To maintain strength, and minimize weight, the longerons are placed to be straight as possible. The only curvature is that due to the basic streamline shape of the fuselage.
6.4.2 Skin Thickness
The fuselage is modeled as a hollow cylinder in order to determine the required thickness. In order to account for lightning strikes and other considerations, a minimum material gauge for material thickness for is 0.06 inches.
[http://adg.stanford.edu/aa241/structures/structuraldesign.html] The calculated required thickness for the chosen material, Al Clad 7075-T6, is 0.0243 inches. Therefore, a thickness of .06 inches is more than sufficient.
6.5 Wing Design
As mentioned before, weight is a primary concern for the design. However, the wing must withstand a great deal of stress, and must therefore be strong and robust in design. The sizing constraints are defined by the airfoil thickness and the taper ratio. Also, ample space must be allotted for air to travel from the engine to the flaps for the IBF portion of the mission. The analysis determines the stress experienced by the wing based on spar design. This requires calculations of lift load and weight distributions; shear forces, and moments along the wingspan. The stress is then compared to known compressive stresses for various materials: the design stress must be less than the stress of the material. Once materials are chosen, the weight of the wing can be determined. Weight calculations include only the structural components. Excel was utilized to compute the design variables.
Figure 6.5a: One spar for the wing.
For the analysis, the wing has been divided into ten equal sections of 11.75 feet. It is crucial to analyze the wing at these various points, to be certain
6.5.1 Spar Sizing
The initial concern is to create a “torsion box”. At least two spars are required to do so. If the wing were to be supported by one spar, the wing would fail due to shearing forces on the skin and ribs. The challenge lies in determining how many spars to use: reduce the size and increase the number of spars, or vise versa. Also, there are many cross-sectional designs for spars: shapes such as “S”, “D”, “I”, etc. The I-beam is the strongest and was chosen for all spars on Falcor. The dimensions for the I-beam are displayed in Figure 6.5.1a. It consists of two caps and a web, with the majority of the load being carried in the caps.

H = 2.2 feet
h = .35 feet
B = 1.5 feet
b = .06 feet
Figure 6.5.1a: Cross sectional view of spar.
The challenge was to minimize all dimensions to save weight. Based on the dimensions of the I-beam, the maximum bending stress can be found. This can then be compared to the ultimate stress of various materials. The CAD program, Autodesk Inventor, was used to calculate the volume of 3D objects. This was crucial in making the final decision. With every change made to the spar, the dimensions in Inventor were easily changed. This made it possible to keep checking the volume or weight of the spar.
Having multiple spars decreases the size of each individual spar. However, the weight of two spars proved to be less than the weight of configurations that consisted of three or more. This is due to the geometry of an I-beam. The spars are placed at thirty and seventy percent of the chord. These values are standard for front and rear spar placement [Niu, 1997]. This placement allows sufficient space for the ducted compressed air for IBF’s. The spars are also positioned this way based on constraints for high lift devices. Slats on the leading edge and flaps on the trailing edge consume large portions of the wing because they retract into the wing.
Falcor’s wings consist of two identical spars. They taper with the same ratio as the wing: λ = 0.35. The spars are analyzed as a cantilevered beam rigidly supported at the root. The unsupported length is 117.3 feet (one half the span). This configuration provides ample support for torsion, and shearing and bending stresses. To analyze these stresses, the wing is divided into ten equal sections of 11.75 ft. Each segment is analyzed to determine where the maximum loads are. The final step is to determine the type of material that can provide sufficient support.
6.5.2 Rib Sizing and Spacing
The ribs in the Falcor’s wings provide a skeleton structure over which the wing skin is attached. The ribs carry a small portion of the load and are therefore not included in the bending stress analysis. The stringers provide minimal support for compressive and tensile stresses. Therefore to save weight, more ribs were added and stringers were not used. There are thirty-three ribs equally spaced spanwise throughout half of the wing. The design of the ribs is constrained by the spacing of the spars and the shape of the airfoil. Each rib is a basic “truss” design. They are all .03 inches thick. These structures carry a negligible amount of the load and can therefore be extremely thin. Falcor’s high lift devices and control surfaces run the majority of the span. Consequently, a great number of ribs are needed to form the wing.
The ribs are placed parallel to the flight path. This configuration is based on an example for the Lockheed L-1011 [Niu, 1997].
6.5.3 Spanwise Lift Load and Weight Distribution
The variation in lift along the span is due to the finite aspect ratio of 0.35; it decreases from the root to the tip. The values of lift are a result of Shenck’s method. The wing is modeled as both an ellipse and a trapezoid. The distribution is then based on an average between the two. This equation comes from both the lecture slides Wroblewski and Corke, 2003. The results of Shenck are represented in Figure 6.5.3a. It can be seen the maximum value of lift is located at the root and the minimum is at the tip.
FIGURE 6.5.3a: Spanwise Lift Distribution
The spanwise lift is proportional to the taper ratio of the wing. This represents loads on the wing due to aerodynamic loads. The trend is uniform because no high lift devices are deployed during the cruise segment. The lift is due solely to the NACA 641-412 airfoil.
The weight distribution varies along the span in a similar manner: greatest at the root and least at the tip. This weight represents only the structure. It does not include any other component, like the engines, fuel tanks and ducting for example.
FIGURE 6.5.3b: Spanwise Weight Distribution
The linear trend is expected. In the absence of the other weight components, the wing structure uniformly tapers from root to tip.
In addition to aerodynamic loads, each wing must also support the load of a 10,000-pound engine. This is included in the calculations for the critical loads.
Critical Loads: Shear Forces and Moments
These loads account for the aerodynamic loads, the load due to the structure of the wing and the weight of the engine. All other weight components are neglected for this analysis.
Both shear forces and the moments are greatest at the root of the wing and zero the tip. There is no force shearing the tip, due to the lack of material, and therefore creates no moment. The analysis is a classic shear and bending moment analysis based on simple mechanics of materials. It evaluates each segment of the wing individually, by summing moments and forces at the end of the segments. Figures 6.5.4a and 6.5.4b show shear force and moment, respectively, along one wing.
FIGURE 6.5.4a Shear force per unit span.
FIGURE 6.5.4b Moment per unit span.
The discontinuity of the plots represents the load due to the engine. For most aircraft, this would be a more dominant feature, however, one engine is 3% of Falcor’s gross weight, and will have less of an effect as a result. The moment hardly displays the existence of the engine due to the fact the engine is placed near the center of lift of the wing.
6.5.4 Deflection
Given a wingspan of 235 feet, one can expect the deflection to be rather high. Falcor’s wings deflect a maximum value of 5 feet. This is experienced at cruise for a maximum gust velocity of 33 ft/sec and a load factor of one. Figure 6.5.5a displays the absolute magnitude of the wing’s deflection.
FIGURE 6.5.5a: Deflection of wing at cruise with a load factor of one.
The deflection of the wing depends on the sizing of the spar and the material chosen. The deflection does not play a crucial role in the analysis. It is not a driving design factor. The Falcor’s deflection of 5 feet is an appropriate value given the magnitude of the wingspan. This deflection creates an angle of 2.5 degrees.
6.6 Horizontal Tail Design
The horizontal is similar to the wing, but contains only one spar. The analysis of the H-tail does not include the presence of the vertical tails. It evaluates the tail as a single component.
6.6.1 Sizing and Layout
The sizing of the tail was based on the aerodynamic and stability needs. Given the span and the aerodynamic constants associated with the airfoil, the sizing of the structural components was determined.
6.6.2 Lift Load Distribution
These values were found using the same method as the wing analysis. Both the weight and lift distributions follow similar trends, and for the same reasons.
Figure: 6.6.2a: Lift distribution per unit span of tail.
Figure: 6.6.2b: Moment per unit span of tail.
It can be seen from these figures that the lift and moment are greatest at the root of the tail.
6.6.3 Shear Forces and Moments
Again, the tail displays similar trends as the wing. However, in the absence of the engine, the shear forces are purely uniform, as are the moments.
Figure 6.6.3a Shear Force of Horizontal Tail
Figure 6.6.3b Moments per unit span of horizontal tail.
6.7 Material Selection
A combination of structural design and material selection that determine the maximum loads that the aircraft can endure. There is a constant compromise that must be made between sizing and type of material. Steel, for example, is denser than aluminum, where aluminum is denser than most composites. Given the dimensions of structural components, a design stress is determined. This multiplied by the design load factor must be less than the stress of the pertinent material. In addition to analyzing stresses, the weight of each item must be looked at. Being a STOL cargo aircraft, weight must constantly be in the front of one’s mind when designing. As a result, the strongest, lease dense materials are perfect for Falcor. By using excel in co ordinance with Autodesk Inventor, there can a constant play between sizing, stress analysis, and weight. The following is a list of materials considered for Falcor:
Table 6.7a: List of Considered Materials
|
|
STEEL |
|
1 |
Aircraft Steel |
|
2 |
Low Carbon Steel AlSI 1025 |
|
3 |
Low Alloy Steel D6AC |
|
4 |
Chrom-moly Steel AlSi 4130 |
|
5 |
Stainless Steel AM - 350 |
|
6 |
Stainless PH 15-7 |
|
|
ALUMINUM |
|
7 |
Al-2017 |
|
8 |
Clad 2024 Sheet and plate |
|
9 |
Clad 2024 Extrusions |
|
10 |
Clad 7178-T6 Sheet and plate |
|
11 |
Clad 7178-T6 Extrusions |
|
12 |
Clad 7075-T6 Sheet and plate |
|
13 |
Clad 7075-T6 Forgings |
|
14 |
Clad 7075-T6 Extrusions |
|
|
TITANIUM |
|
15 |
Ti - 6A1-4V |
|
16 |
Ti - 13V - 11Cr - 3Al |
|
|
COMPOSITES |
|
17 |
High Strength |
|
18 |
Graphite/Epoxy |
|
19 |
High Modulus |
|
20 |
Graphite/epoxy |
|
21 |
Boron/Epoxy |
|
22 |
Graphite/Polyimide |
|
23 |
S-Fiberglass/Epoxy |
|
24 |
E-Fiberglass/Epoxy |
|
25 |
Aramid/Epoxy |
6.7.1 Fuselage
The two components of the fuselage for which material is specified are the longerons and the skin. Aluminum proved to be the popular choice: Al Clad 2024 for the longerons and Al Clad 7075-T6 for the skin. Both materials are extremely strong and widely used on aircraft for the structural members. Clad 2024 and 7075-T6 have a densities of .100 lb/in3 and .101 lb/in3 with values of elastic modulus of 1.08x10⁷ and 1.04x10⁷, respectively. Both materials perform well in corrosive environments, and have relatively high strength to weight ratios. It can be seen in Figure 6.7.1a how the material for the skin was chosen. The yellow bars represent the required thickness. The choice is made independent of specific thickness values, due to the minimum gauge.
Figure 6.7.1a: Material selection for wing skin.
An ideal choice would be material #13: a composite of graphite and epoxy. This material is in the minimum weight category and requires the minimum thickness. However, the price for such a material is exceedingly high. Therefore, Material #8, Clad 7075-T6, is used. This form of aluminum is readily available, cheaper, and strong enough to withstand the loads. The longeron material was determined in the same manner.
6.7.2 Wing
The wing consists of three major components: the spars, ribs, and skin. The spar carries the largest of all the structure. It must be extremely strong. Al Clad 7075-T6 will also be used here. There are no special considerations for the IBF’s in the case. The air being blown over the flaps is ducted from the bypass air of the engine and is therefore the temperature of the atmosphere. This is kept in mind when deciding the wing skin material. To determine the volume of the skin, the minimum gauge for thickness multiplied the wetted surface area. To save a great deal of weight, approximately 5,300 pounds, a composite material consisting of E-fiberglass and epoxy is used. The density of this material, 0.071 lb/in3, is about 25% lighter than aluminum. Although more expensive, it is worth the cut in weight. Composites were chosen for the ribs and bulkheads as well. They do not carry as much load as the spar, and can therefore do not require Aluminum. A high strength graphite epoxy composite with a density of 0.056 lb/in3 was chosen. It is one of the lightest materials used in aerospace structures. Because so little volume is needed to build these components, the cost of using a more expensive material is not as high as if it were used for the spar.
6.7.3 Tail
For the same reasons as the fuselage and the wing, the tail is made of aluminum for the skin and spar, and graphite epoxy for the ribs and bulkheads. The skin material is Al Clad 2024 and the spar is made of Clad 7178-T6 (density = 0.102 lb/in3 and E = 1.03x10⁷). This is comparable to the DC-10, which uses Al 7075-T86 for the skin.
6.8 Flap Analysis
Falcor utilizes large high lift devices in order to obtain a STOL performance. The enhanced lift greatly increases the loads on the aircraft. To find the forces due to the flaps, the lift that they generate must be known. These values combined with the drag produce a resultant force.

Figure 6.8a: Schematic of loads experienced by flaps.
Lift from flaps have values of 70,332 pounds 45,751 pounds, respectively. These combined with a drag of –130,533 pounds give resultant forces of 148,274 pounds and 138,318 pounds, respectively. Al Clad 2024 will be used for the flap material.
6.9 Summary
The principle design drivers for the structural analysis were the loads experienced by the aircraft, the limit load factor of 2.75, and weight. The sizing of the components in co ordinance with the aerodynamic forces, determined the design loads. The appropriate materials were selected based on their strength to weight properties. This analysis required light coordination with the other engineers. It depended on the results of the analyses performed by the aerodynamic and stability engineers.
The most challenging aspect of the design was cutting weight. Components, such as the spars, needed to be large enough to support the heavy loads experienced by the wing. The results are large pieces of aluminum structures making up the wing out both sides of the fuselage. This, if not optimized, can add a great deal of weight. For all components, a compromise was made between sizing and strength. In the end, Falcor will certainly be able to withstand anything both nature and the enemy throw at her.
7. Cost
7.1 Introduction
With a flyaway cost of $68.25 million each, the Falcor ATT is a low cost tactical airlifter even though it makes use of advanced technologies and composite materials. Aircraft cost is so low due to the production expectations for the aircraft. Over 2,000 C-130 Hercules (Including Variants) have been built, the Falcor’s estimated production run of 877 aircraft represents the number of C-130s in US Military Service. This large production run allows the aircraft to be produced inexpensively.
The operating costs for the Falcor are reduced by its engine commonality with the C-17 Globemaster. Ground crews will be experienced with the engines service and have a large supply of spare parts. Crew costs are the largest portion of the aircrafts operating costs.
7.2 Methodology
The aircraft acquisition cost was calculated using Excel and the method outlined by Wroblewski. Values for Maintenance Man Hour per Flight Hour were assumed to be 30 hours per flight hour and Utilization was assumed to be 1,200 hours per year as per Raymer and Wroblewski. A production run of 877 aircraft at a rate of 2 aircraft per month was also assumed. A crew of 4 consisting of two pilots, a loadmaster, and a mission specialist is assumed. Costs were compared to similar aircraft to ensure an accurate estimation of cost. All values were converted to fiscal year 2005 dollars, when the funding process would begin in order to begin replace retiring C-130s around FY2011.
7.3 Acquisition Cost
The Falcor flyaway of $68.25 million is very reasonable considering the technology it employs. The large production run leads to large savings in manufacturing and tooling costs. Production run size has a dramatic affect on the aircraft flyaway cost. A trade-study was done to verify that the flyaway cost obtained was accurate and to better examine how production run affected the cost.
Figure 7.3a Production run vs. acquisition cost.
7.3.1 RDT&E Cost
Research, Development, Testing and Evaluation cost for the Falcor ATT program are just over $4 Billion. Avionics at the early RDT&E phase account for a large portion of cost since its price cannot be spread over many aircraft. This estimate accounts for six prototype aircraft for testing.
Figure 7.3.1a RDT&E Cost breakdown (RDT&E Cost: $4 Billion)
Tooling and manufacturing for the small number of prototype aircraft is expensive. It also accounts for large portions of the RDT&E costs.
7.3.2 Acquisition Cost
The Falcor ATT acquisition cost is almost $60 Billion in 2005 dollars, a direct result of the large number of aircraft to be built. A majority of the estimated cost if engine cost (Fig. 7.3.2a). The engines are an off the shelf derivative so additional development costs can be avoided. By the time this aircraft is built, the P&W F-117 will have been in production for some time driving engine cost down. Manufacturing is the next largest portion of the acquisition cost due to the large production run. A standard 10% profit has been assumed since this is an aircraft for the Department Of Defense.
 Fig. 7.3.2a Falcor
Acquisition Cost Breakdown (Acquisition cost: $60 Billion)
Fig. 7.3.2a Falcor
Acquisition Cost Breakdown (Acquisition cost: $60 Billion)
7.3.3 Comparison
The Falcor ATT’s acquisition cost was compared to the cost of similar aircraft. Although the aircraft costs more than the C-130H and C-130J variants, the Falcor is a much better value (Table 3.2.3a). It’s flyaway cost per pound of cargo and per pound of structural weight is lower than both C-130 models. The savings over a modernized C-130J and the recently deployed C-17 Globemaster is significant.
Table 7.3.3a Cost Comparison to similar aircraft (All FY2005)
|
Comparison |
Flyaway Cost (2005 $) |
|
Flyaway Cost Per Lb Cargo |
Flyaway Cost Per Lb Empty Weight |
|
C-17 |
$268,750,000 |
|
$1,590 |
$970 |
|
C-130J |
$56,395,349 |
|
$1,567 |
$684 |
|
C-130H |
$35,000,000 |
|
$959 |
$464 |
|
Falcor ATT |
$68,241,762 |
|
$853 |
$246 |
7.4 Operating Cost
Operating costs were predicted to be about $530,000 per cycle for a tactical airlift mission. This is equivalent to $343 per nautical mile. Of this cost, roughly two thirds are direct operating costs and one third is indirect operating costs.
Table 7.4a Operating Costs
|
|
Per Nm |
Per Cycle |
|
Direct Operating Costs |
$229 |
$353,905 |
|
Indirect Operating Costs |
$114 |
$176,953 |
|
Total: |
$343 |
$530,858 |
The largest portions of the operating costs are crew costs, followed by depreciation. Crew cost is so high because of the cost to train and maintain multiple highly skilled aircrews for each aircraft. Fuel cost are also significant, over 50,000 lbs or fuel is burned during the tactical transport mission. Maintenance labor and parts account for very little of the operating cost. Maintenance savings due to engine commonality with C-17 will lead to even better maintainability.
 Figure 7.4b Operating
cost breakdown (Operating Cost: $530,000 per cycle).
Figure 7.4b Operating
cost breakdown (Operating Cost: $530,000 per cycle).
8. Conclusion / Summary
The Falcor ATT is an ideal replacement for the aging C-130 fleet. With a cargo capacity of 40 tons and take-off distances as short as 400 ft fully loaded, the Falcor gives commanders unmatched Intra-theater airlift flexibility.
The use of a high lift wing and blown flaps allow the Falcor to take-off at very low speeds and in short distances. A careful balance between high lift at take-off and low drag at cruise was established.
The Pratt and Whitney turbofan engines powering the Falcor supply ample thrust at take-off while still providing enough performance to allow the aircraft to cruise at high altitude. The Falcor uses the propulsion system to increase the lift the aircraft produces at take-off, allowing very short take-off distances.
Fuel is used to shift the aircraft center of gravity to balance neutral point by shifting fuel the Falcor is a very stable aircraft. The control surfaces were designed to provide enough authority to complement the flight control system, while not adding unacceptable amounts of drag at cruise.
The Falcor structure was designed to be very robust to carry the large loads the aircraft is capable of transporting. Aluminum is combined with advanced composites to create a strong design while saving weight.
The Falcor ATT is the premiere intra-theater tactical airlift for the 21st century.
Recommendations
The Falcor ATT meets or exceeds all of its STOL and payload capacity design objectives. However, the current design contains several aspects that could be modified, given more time and resources. The following recommendations are offered for improvement upon the existing design:
1. As addressed in the propulsion section (see section 4), the wing loading is somewhat lower than the ideal design value (it is currently 61 psf as opposed to 80 psf). The current wing loading is limited by the range of the drag bucket of the Falcor airfoil, which was sized and developed based on the initial size, weight and drag estimates. Even with the large range of operation allotted by the drag bucket, the Falcor airfoil would need to be redesigned for this sufficiently refined range of wing loading, which would vastly change the aerodynamic properties of the Falcor, which was unable to be done late in the design process.
2. Also addressed in the propulsion section is the concept of a bypass (fan) bleed IBF system. This is a revolutionary idea, in contrast to standard engines that bleed directly from the compressor. As discussed in Section 4, the benefits from this system are that it decreases the effect of removing air on the thrust produced by the engine. This allows better operation at STOL conditions, and in fact moves the ideal design wing loading to nearly 100 psf.
With the implementation of these two recommendations, the already extraordinary STOL performance of the Falcor ATT cannot only be somewhat improved, but can allow the Falcor layout to closely match that of a standard transport aircraft. This would create a new generation of transport aircraft, which would provide super STOL performance with competitive transport, cruise, and loiter operation.
References
Abbot and Von Doenhoff, Theory of Wing Sections, Dover, NY, 1959.
Advanced Aircraft Analysis Software, DAR Corporation, Kansas, 2002.
Advanced Theater Transport (ATT), (Dec. 1st 2002) www.globalsecurity.org
/military/systems/ aircraft/att.htm
Corke, Thomas C., Design Of Aircraft, Prentice Hall, New Jersey, 2003
Etkin, Bernard and Reid, Lloyd Duff, Dynamics of Flight, John Wiley and Sons, Inc, 1996
Goodmanson, L. T. and Gratzer, G. T., “Recent Advances In Aerodynamics For Transport Aircraft Part 1,” 1973
Gordon, John and Orletsky, David, Moving Rapidly to the Fight, RAND Corp., CA
Kuethe and Yen-Chow, Foundations of Aerodynamics 5th Edition, John Wiley and Sons Inc., 1998.
Military Specification: Flying Qualities of Piloted Airplanes, MIL-F-8785C, Nov 5th, 1980.
Munson, Young, Okiishi, Fundamentals of Fluid Mechanics Forth Addition, Iowa, John Wiley and Sons Inc, 2002.
Nelson, Robert C., Flight Stability and Automatic Control, McGraw-Hill, Boston 1998.
Niu, Michael, Airframe Structural Design : Practical Design Information and Data on Aircraft Structures, McGraw Hill, 1997
Oates, Gordon C., Aerothermodynamics of Gas Turbine and Rocket Propulsion Third Edition, AIAA, Ohio, 1997
Raymer, Daniel P., Aircraft Design: A Conceptual Approach, AIAA, Ohio, 1999.
Roskam, Dr Jan, Airplane Design Part VI, Roskam Aviation and Engineering Corp., Kansas, 1998
Thomas III, William R., C-130 E Ops Limits / Numbers, 1999.
Bibliography
Advanced Theater Transport, http://www.boeing.com/phantom/att.html
Antonov AN-72 “Cheburashka, http://www.cheburashka.5u.com/main.html
Asuka STOL Experimental Aircraft, http://www.nal.go.jp/flight/eng/museum/aska/ aska.html
C-17 Globemaster III, http://www.globalsecurity.org/military/systems/aircraft/c-17.htm
Wimpress, John and Newberry, Conrad, YC-14 STOL Prototype, AIAA, Virginia, 1998
YC-14/YC-15, http://www.globalsecurity.org/military/systems/aircraft/amst.htm
Thomas III, William R., C-130 E Ops Limits / Numbers, 1999
Appendix
GlobalSecurity.org ATT Article Pg. 142
C-130 Specifications (Lockheed Martin) Pg. 144
Other analysis located on E-ppendix
Advanced Theater Transport
In the long term (FY11-21) the Air Force plans to begin acquisition process for the Advanced Theater Transport to replace C-130s as they retire. The Advanced Theater Transport concept would allow delivery and extraction of medium-weight fighting systems and their support at a much wider range of air terminals than is now available. Among the designs being considered are tilt-rotor and inclining-wing concepts that potentially could get 30-plus ton loads in and out of runways as short as 500 feet.
This long term replacement aircraft for the C-130E/H includes enhanced reliability, maintainability, and availability; advanced cargo handling features; super short take-off and landing capability; oversized/outsized cargo capability; high speed/low level airdrop capability; articulated cargo ramp; high lift systems with externally blown flaps; fly-by-wire capability; off-the-shelf derivative engines; cross-shafted propellers and rotors; off runway landing gear; advanced cockpit design with autonomous landing capability and onboard mission planning. Survivability features include IR suppression, reconfigurable flight controls, damage tolerance, and California Bearing Ratio hardening. In addition, it must have at least the same capabilities as C-130J.
The ATT tactical mission is a 1,000 km radius, Hi-Low-Low-High profile with SSTOL landing and takeoff at mid-point. The mid-point and the 100 nm on either side of mid-point are at 4,000 ft MSL (above mean sea level) on a 95 ºF day. The rest of the mission is flown at optimum altitude on a standard day. A 30 ton payload is carried both out and back. The ATT has full 3.0g combat maneuverability and low altitude dash speed capability under these conditions. The initial takeoff is from a long runway and is not a limiting factor. The mid-point takeoff and landing performance plot is based on the ATT tactical mission profile. The mid-point gross weight includes enough fuel to fly a 1,000 km return leg plus a fuel reserve. The runway length (ground roll) required to carry a 30 ton payload is just over 750 ft for landing and just under 750 ft for takeoff. The total landing zone length (including runway) for landing over a 50 ft obstacle is just over 1,250 ft for a 30 ton payload. These numbers are based on wartime “assault rules” which allow the ATT to roll beyond the end of the runway after an engine failure.
The payload range plot is based on a deployment mission profile. The entire mission is flown at optimum altitude on a standard day, without a mid-point landing. This is more fuel efficient than the tactical mission profile. Hence the range for a 30 ton payload (1,300 nm or 2,400 km) is greater than the 2,000 km needed to fly a 1,000 km radius tactical mission. ATT can deploy with a 40 ton payload (e.g., two 20 ton FCS) at a 2.25g load factor. Operation at the high Maximum Takeoff Gross Weight (MTOGW) allowed by a 2.25g load factor is restricted to emergency wartime situations due to structural limitations on turbulence penetration and maneuverability. This is a caution area in the flight manual. ATT can carry a 36 ton payload at its normal 2.5 g load factor. Normal operation has limitations on maneuverability and low altitude dash speed compared to combat operation.
Two concepts in direct competition with each other are the Advanced Theater Transport (ATT) aircraft designs of Boeing and Lockheed.
In May 2000 Boeing unveiled a Advanced Theater Transport "Super Frog" concept, a four-engine, tailless STOL tiltwing that can carry 80,000 pounds, cruise up to 410 kts, and land at speeds as low as 36 kts. The Boeing ATT concept is a four-engine, no tail, tilt-wing aircraft capable of landing and taking off from strips as short as 600 feet. Boeing plans to design the aircraft so that lift will be generated by the wing itself at all times. While this will rule out VTOL capabilities, it will allow the new airlifter to operate with a 100,000 pound payload. It could carry up to 100 troops or 11 cargo pallets-as well as ground vehicles such as Humvee trucks. Examples of possible cargo loads include: one Army MRLS rocket launcher with missiles, two Humvees and 40 troops; or five Humvees and 32 troops; or one 5-ton truck, one 8-ton truck and 40 troops. The ATT would carry twice the load and operate in about three-quarters of the C-130J's required ramp space. The wing in the ATT tilts upwards in a 45-degree angle, leading to a propulsion requirement for 50,000 pounds of thrust, compared to 150,000 pounds of thrust for vertical lift. The aircraft employs high lift devices such as externally blown flaps, similar to those used on the C-17. Initial analysis on this concept concluded that with the fly-by-wire flight control system and design of the body, the control effectiveness at slow speed offered by an elevator is marginal. For this reason and in the interest of weight savings, the present design calls for a tailless configuration. The wingspan and length of the aircraft are less than that of a C-130, while the fuselage is almost twice as wide.
Powered by four (eight-bladed) turboprop engines, the aircraft features a tailless fuselage with a forward swept tilt-wing arrangement. This unique configuration provides for enhanced performance capabilities for landing and takeoff within 750 feet carrying 80,000 pounds of payload in very austere operating conditions. The tilt-wing design and computerized flight controls allow for steep ingress and egress angles, increasing flexibility in hostile areas, as well as its ability to quickly establish and replenish forces in forward operating areas. With a typical payload of 80,000 pounds, the ATT can fly more than 3,000 nautical miles. It can also use its 115,000 pounds of wing fuel to airlift large quantities of fuel to advancing operating forces. Such impressive strategic and theater lift flexibility would make the ATT concept a valuable asset for theater lift and augmenting vertical lift assets in forward areas. ATT's fuselage cross-section is similar to the C-17 configuration and will be able to accommodate two of the U.S.Army's 20-ton advanced Future Combat System vehicles, as well as additional outsized loads including Bradley vehicles, Patriot missile systems, MLRS (Multiple Launch Rocket System), HEMTT (Heavy Expanded Mobile Tactical Truck) and PLS (Palletized Load System). The ATT's autonomous cargo handling System increases cargo through-put capability and eliminates or minimizes the need for the advance placement of material handling equipment at forward bases.
The Lockheed Circulation Control Wing concept is a subset of boundary layer control. In order to provide continued control at low speeds, the circulation control is basically designed to prevent the wing from stalling. This is done by introducing a high-energy jet onto the upper, trailing edge region of a blunt trailing edged airfoil (occasionally leading-edge blowing is also used). This method to produce lift at low speed, combined with other advanced high lift devices and the lift efficiency of a blended wing-body design, is the cornerstone of the Lockheed ATT strategy for SSTOL. As with the Boeing concept, the concept has not been funded to allow for a prototype. Current analysis shows that to operate with the thirty ton payload set by the Army, the aircraft can land in the required distance, but would require nearly 1,200 feet for takeoff. The 750-foot runway would allow payloads for takeoff of up to 20,000 pounds.
http://www.globalsecurity.org/military/systems/aircraft/att.htm
Maintained by John Pike
Last Modified: December 01, 2002 - 12:38
Copyright © 2000-2003 GlobalSecurity.org All Rights Reserved
C-130 Specifications (Lockheed Martin)
|
C-130 Stats |
|
|
External Dimensions |
Value |
|
Wing span |
132.6 ft / 40.41 m |
|
Wing aspect ratio |
10.1 |
|
Length overall |
97.75 ft / 29.79 m |
|
Height overall |
38.8 ft / 11.84 m |
|
Tailplane span |
52.7 ft / 16.05 m |
|
Wheel track |
14.25 ft / 4.34 m |
|
Propeller diameter |
13.5 ft / 4.11 m |
|
Wing area (gross) |
1,745 ft2/ 162.12 m2 |
|
Internal Dimensions |
Value |
|
Cabin length (excluding ramp) |
40 ft / 12.19 m |
|
Cabin length (including ramp) |
50.7 ft / 15.44 m |
|
Max. width |
10.25 ft / 3.12 m |
|
Max. height |
9 ft / 2.74 m |
|
Total useable volume |
4,551 ft3 / 128.9 m3 |
|
Weights and Loadings |
Value |
|
Operating weight empty |
75,562 lb / 34,274 kg |
|
Max. fuel weight (internal) |
45,900 lb / 20,819 kg |
|
Max. payload (2.5 g) |
41,790 lb / 18,955 kg |
|
Max. normal takeoff weight |
155,000 lb / 70,305 kg |
|
Max. overload takeoff weight |
175,000 lb / 79,380 kg |
|
Max. normal landing weight |
130,000 lb / 58,965 kg |
|
Max. overload landing weight |
155,000 lb / 70,305 kg |
|
Max. zero-fuel weight (2.5 g) |
117,350 lb / 53,230 kg |
|
Max. wing loading (normal) |
88.83 lb/ft.2/ / 433.7 kg/m2 |
|
Max. power loading (normal) |
8.44 lb/SHP / 5.14 kg/kW |
|
|
|
|
Performance |
|
|
Max. cruising speed |
348 kt / 645 km/h |
|
Econ. cruising speed |
39 kt / 628 km/h |
|
Stalling speed |
100 kt /185 km/h |
|
Max. rate of climb at sea level |
640 m/min / 2,100 ft/min |
|
Time to 6,100 m |
12 min |
|
Cruising altitude |
28,000 ft / 8,535 m |
|
Service ceiling at 66,680 kg AUW* |
30,560 ft / 9,315 m |
|
Service ceiling, OEI, at 66,680 kg AUW |
22,820 ft / 6,955 m |
|
Takeoff run |
3,290 ft / 1,003 m |
|
Takeoff run to 15 m |
4,700 ft / 1,433 m |
|
Takeoff run using max. effort procedures |
1800 ft / 549 m |
|
Landing from 15 m at 58,967 kg AUW |
2,550 ft / 777 m |
|
Landing run at 58,967 kg AUW |
1,400 ft / 427 m |
|
Range with 18,144 kg payload and Mil-C-5011A reserves |
2,835 n miles / 5,250 km |
|
Landing run at 58,967 kg AUW |
1,400 ft / 427 m |
|
Range with 18,144 kg payload and Mil-C-5011A reserves |
2,835 n miles / 5,250 km |
This page intentionally left Blank